Tips
Knowledge base analytics: what to measure

10 Min Read
Knowledge base analytics should show whether customers can find, trust, and use your self-service content before they contact support. This guide explains the metrics that matter, how to read them together, and how to turn views, searches, feedback, and contact behavior into a practical improvement loop.
Share article:


What knowledge base analytics should prove
Knowledge base analytics is the practice of measuring how customers use your help content and whether that content helps them solve problems without opening a support request.
That sounds simple, but many teams start with the wrong question. They ask, "Which articles got the most views?" Views matter, but they do not prove self-service is working. A highly viewed article may be useful, confusing, overused because the product is unclear, or ranking for the wrong search query. A low-view article may still prevent high-value tickets if it solves a rare but expensive problem.
The better question is: "Where do customers try to help themselves, and what happens next?"
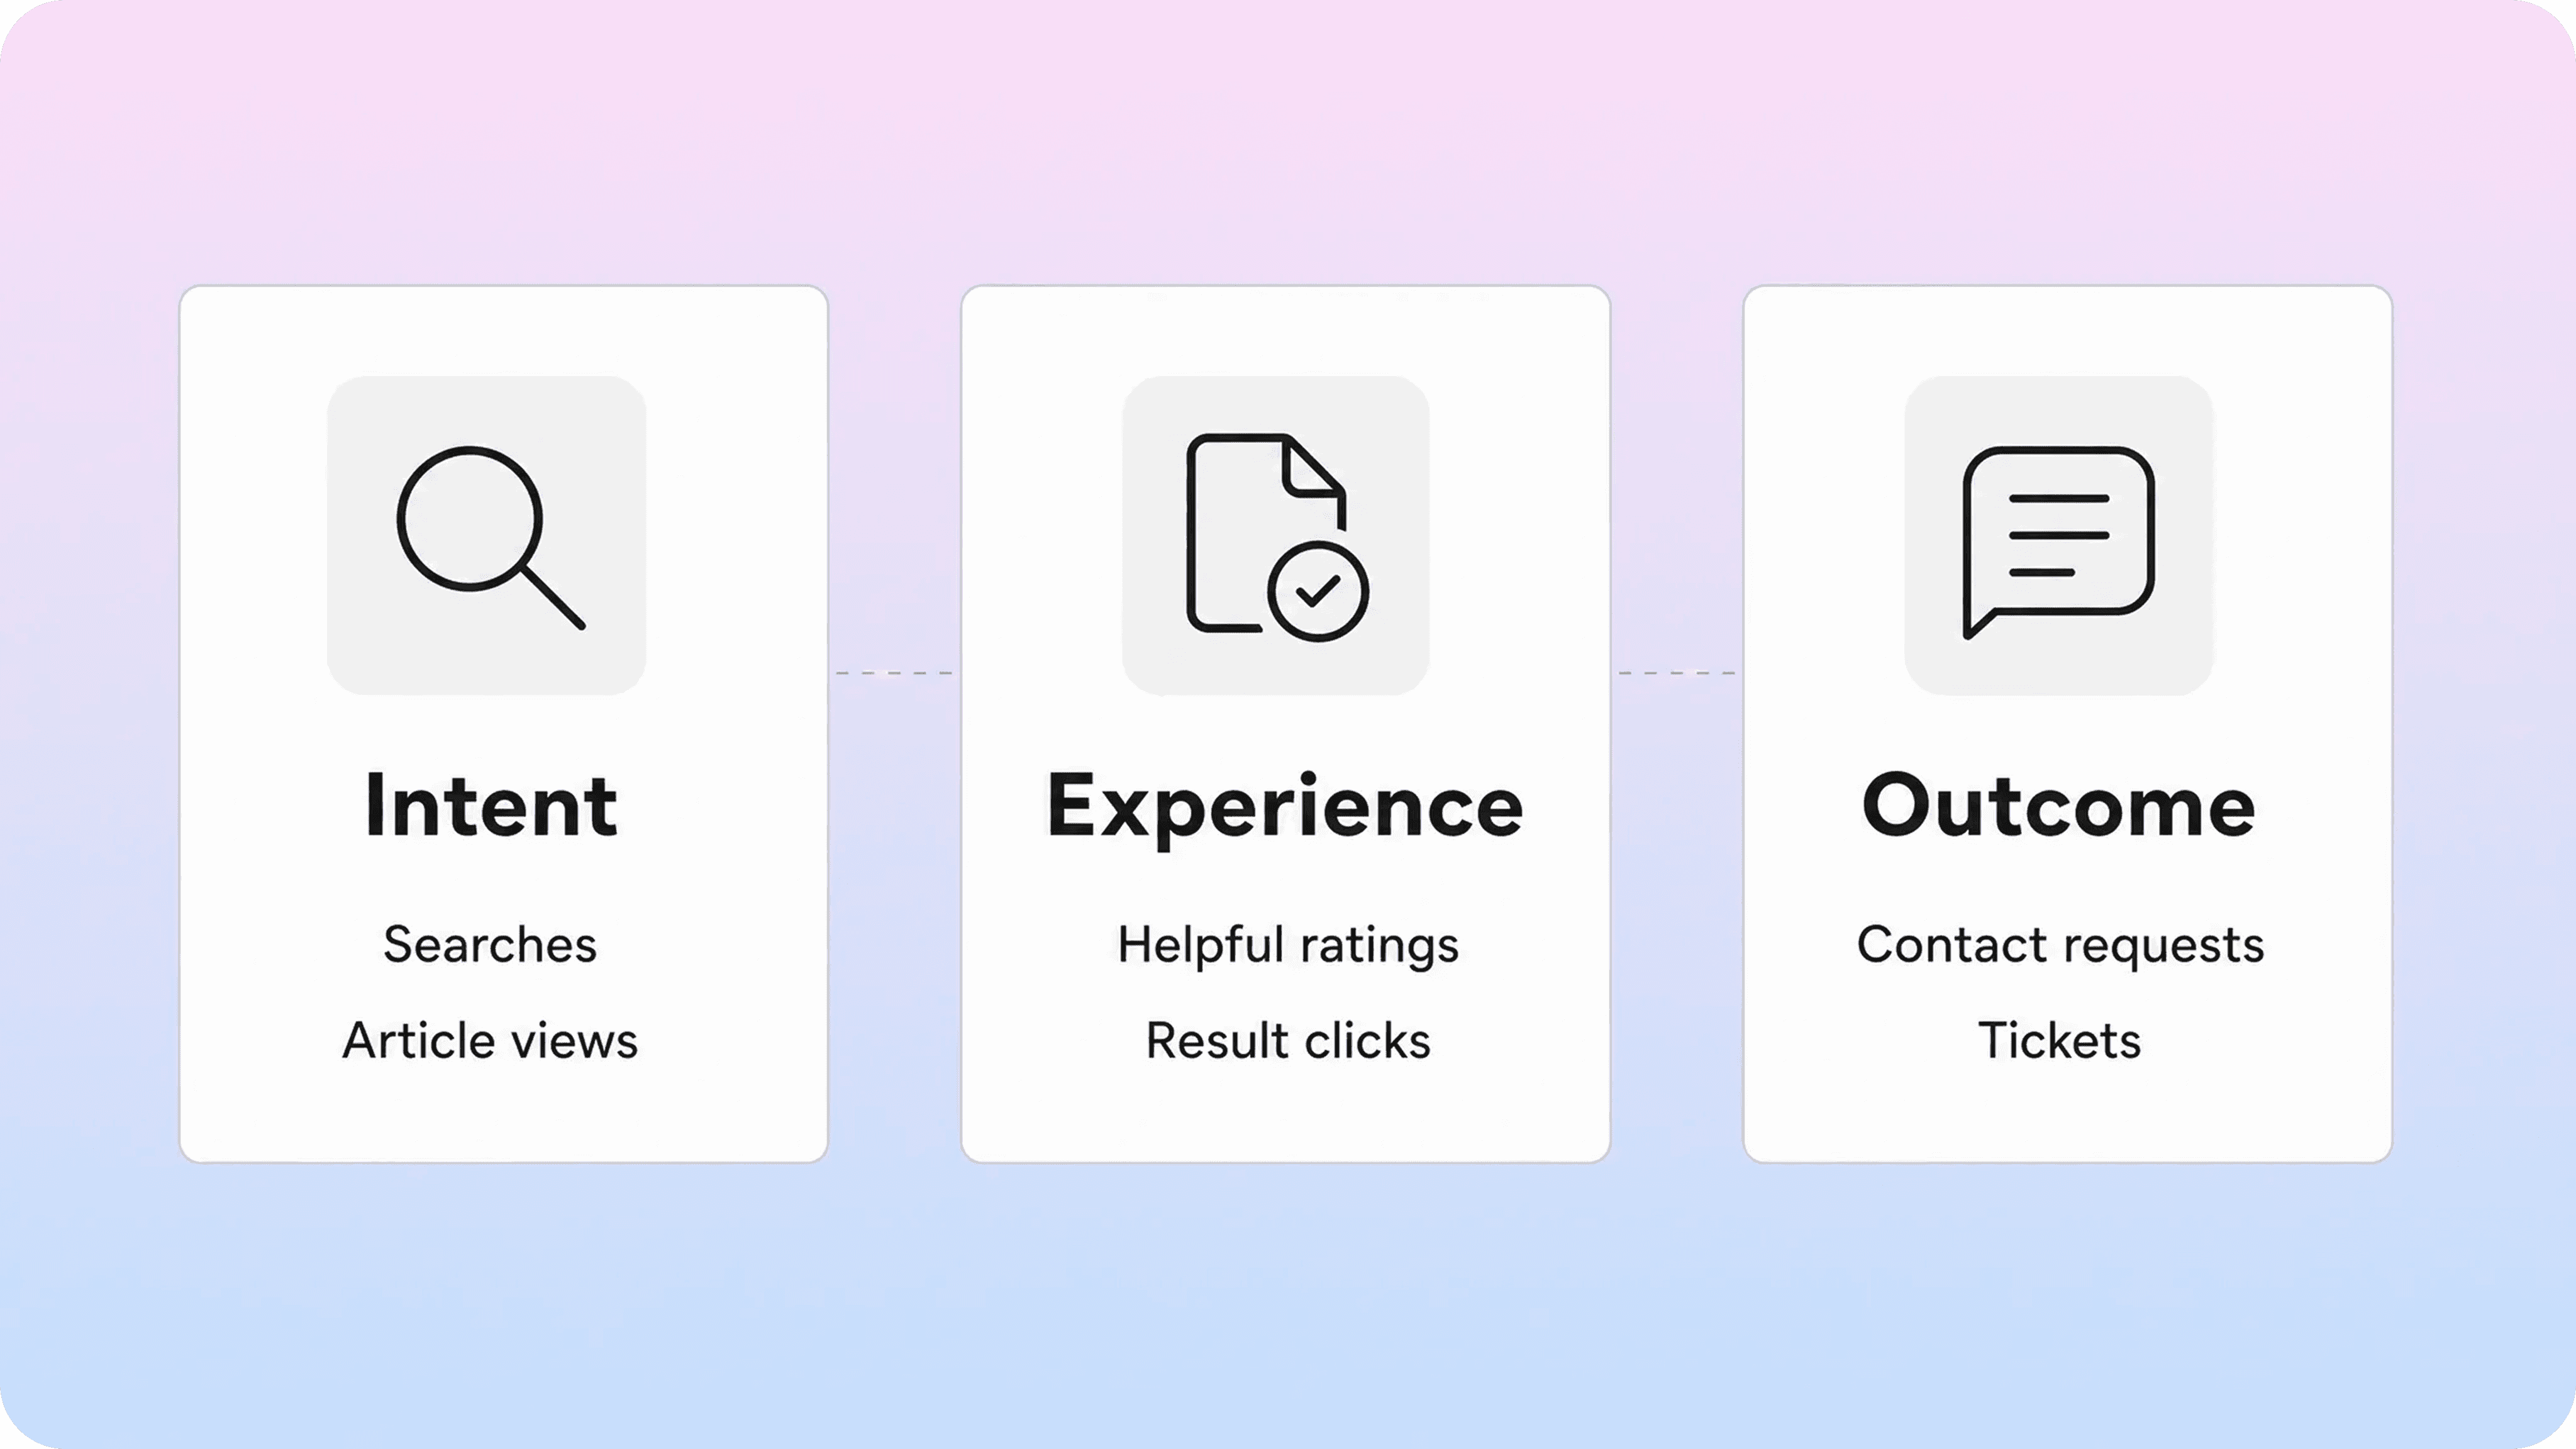
Good knowledge base metrics connect three parts of the journey:
Intent: what the customer searched for, clicked, opened, or tried to solve.
Experience: whether the article was findable, readable, useful, and trusted.
Outcome: whether the customer continued, searched again, rated the article, contacted support, or avoided a ticket.
This is why a useful analytics setup needs more than traffic reporting. Help center analytics should help you see the full path from question to answer. That includes searches, zero-result searches, article views, helpful ratings, contact clicks, support form starts, tickets created, and repeat ticket themes.
For teams using Notion as the writing layer, a dedicated Notion help center can make this easier because the public experience is built around search, categories, article feedback, and customer-facing support paths rather than raw Notion page sharing. Helpview's guide to Notion analytics covers the page-view side in more detail; this article focuses on the wider knowledge base performance metrics that show whether self-service is actually doing its job.
The distinction matters because customer self-service often falls short even when companies invest in it. Gartner reported that only 14% of customer service issues were fully resolved in self-service in its 2024 customer survey, and the most common reason for self-service failure was that customers could not find content relevant to their issue. That is not a page-view problem. It is a measurement, findability, and content-quality problem.
The core knowledge base metrics to track
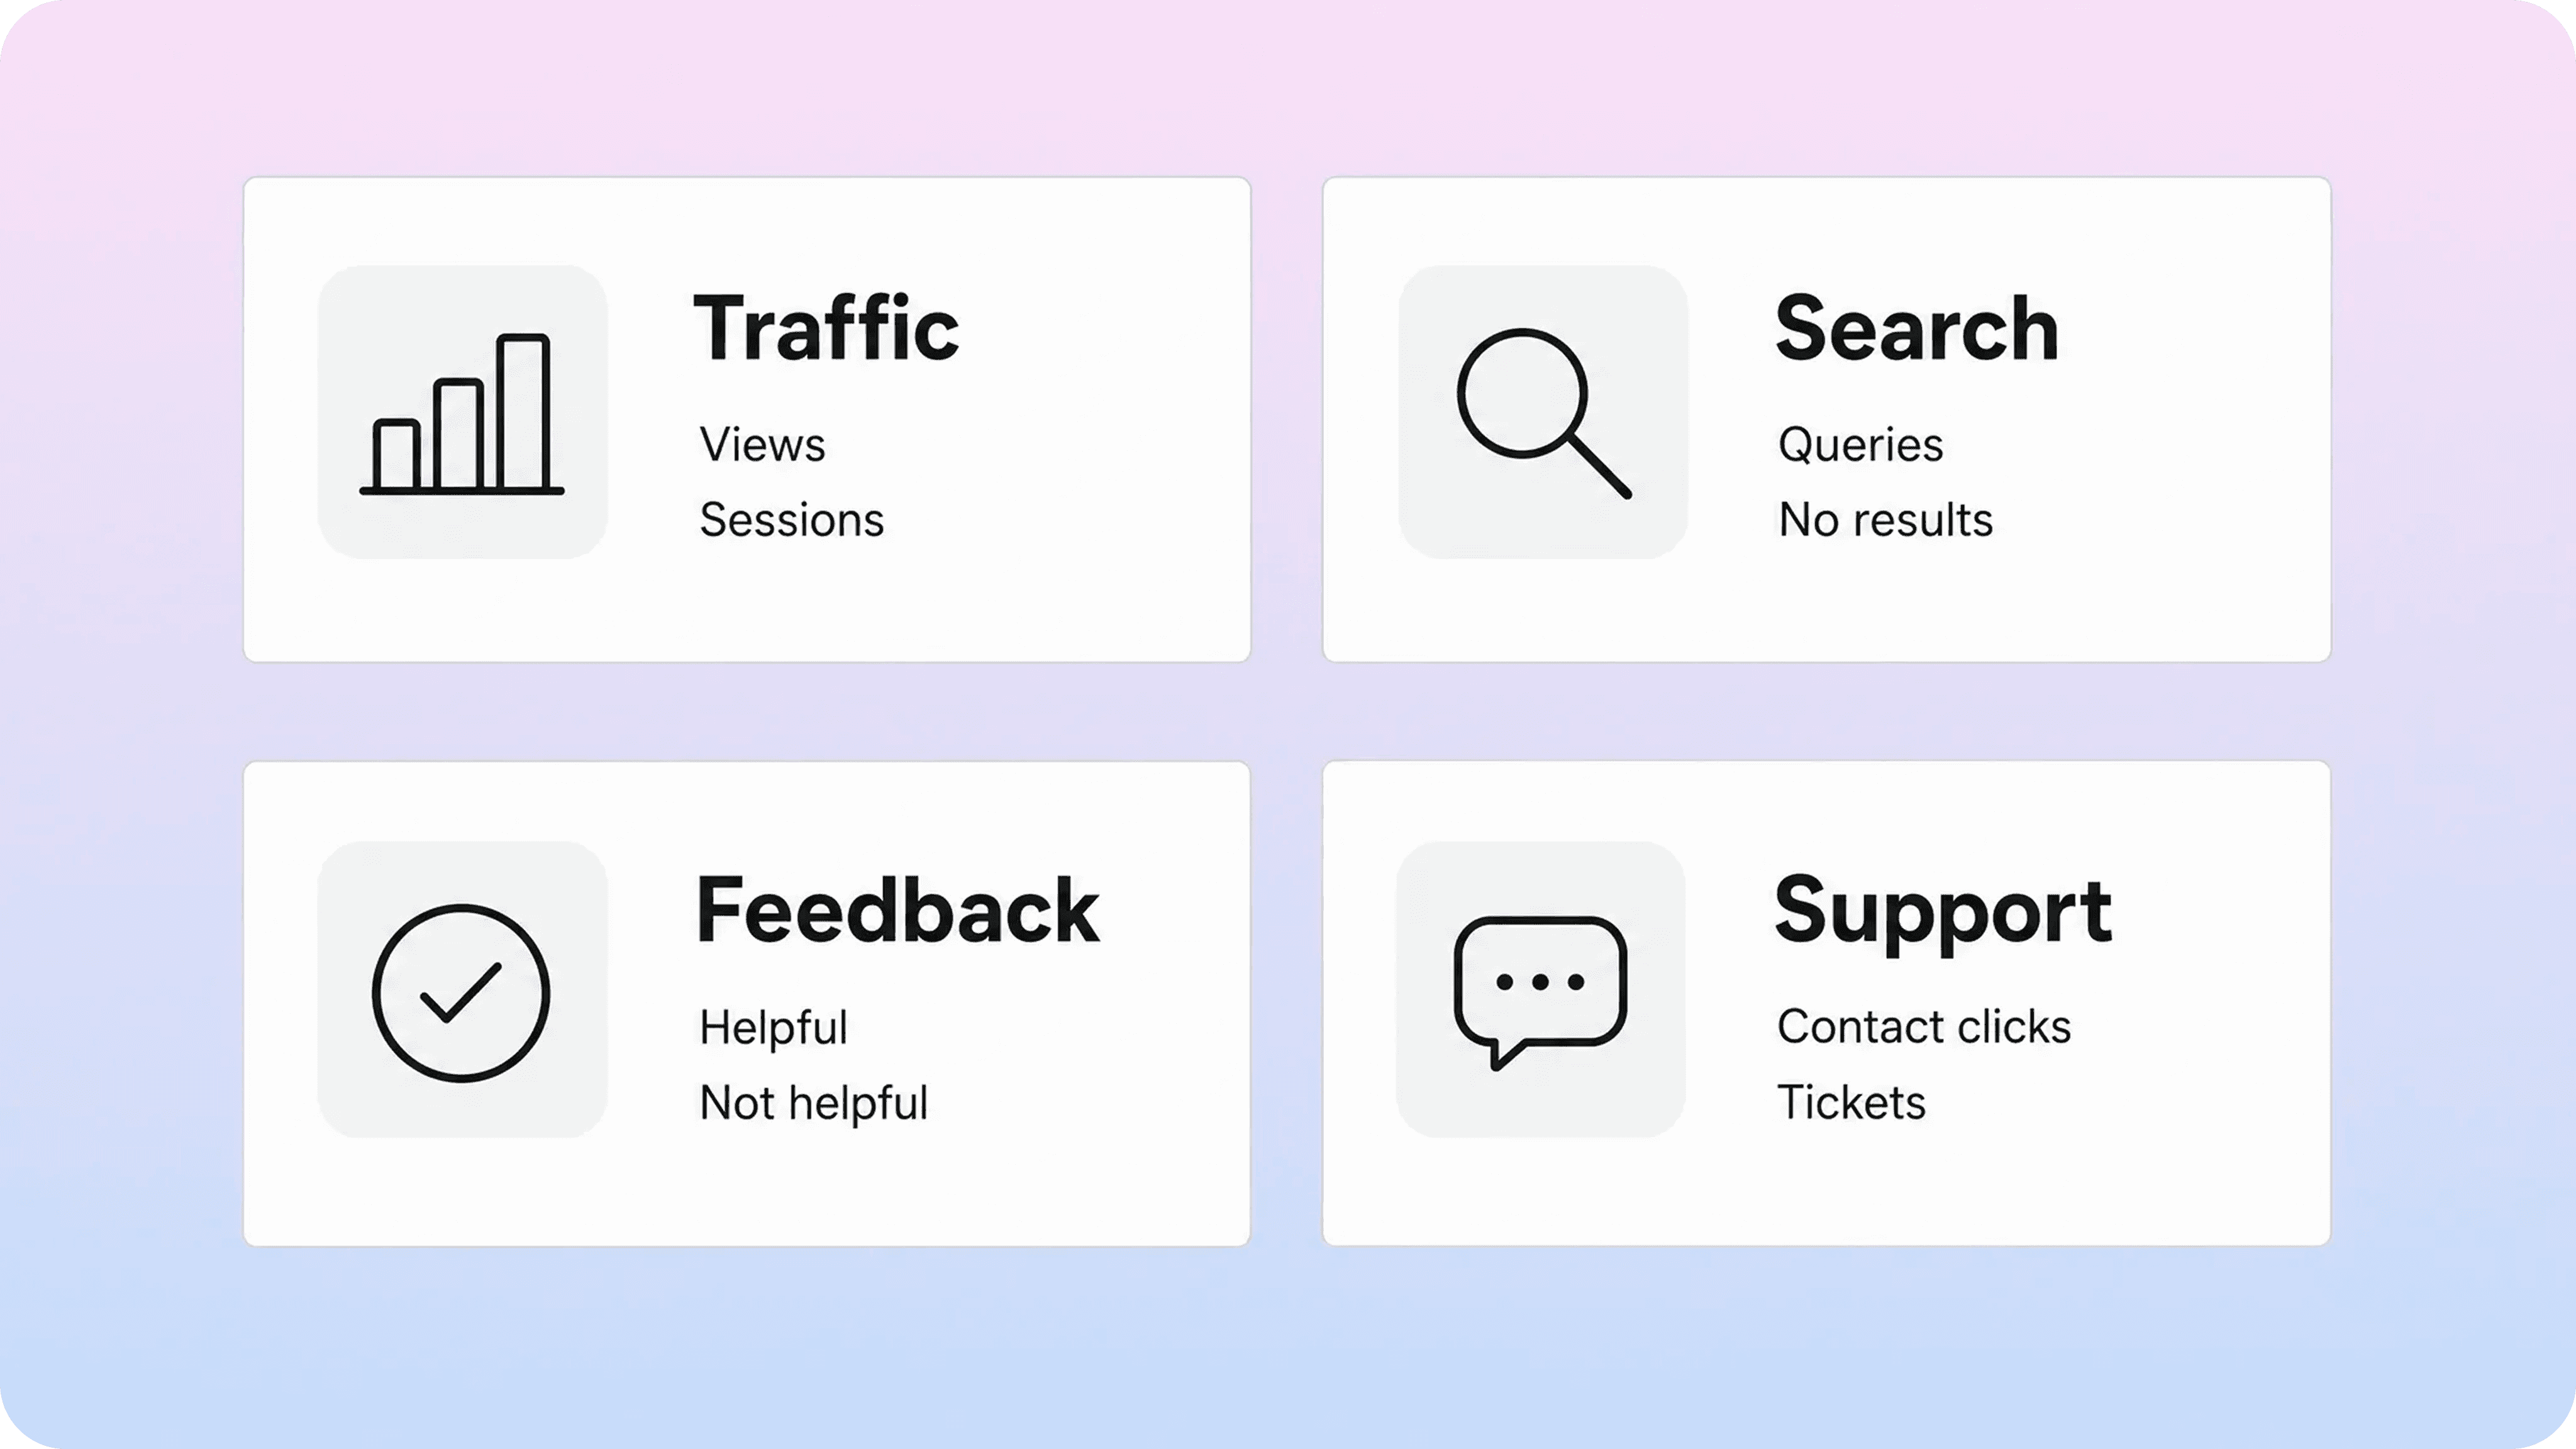
Start with a compact scorecard. If the dashboard gets too large, it becomes a reporting ritual instead of a decision tool.
The goal is not to track every possible number. The goal is to choose enough metrics to explain whether customers are finding answers, whether articles are helping, and where support demand still leaks through.
Metric | What it tells you | How to use it |
|---|---|---|
Article views | Which pages customers open most often | Review high-traffic pages for clarity, freshness, and support impact |
Unique visitors or sessions | How many people attempt to self-serve | Use as the denominator for self-service and contact behavior |
Search queries | What customers are trying to solve | Group terms by intent, not just exact wording |
Zero-result searches | Where search failed to return a useful answer | Investigate missing content, weak titles, and synonym gaps |
Search result clicks | Whether customers trust the results they see | Improve titles, snippets, ranking, and article scope |
Helpful ratings | Whether readers say the article worked | Pair with comments, repeat searches, and tickets before acting |
Contact clicks or form starts | Where self-service starts to fail | Track after article views and after searches |
Tickets after self-service | Which issues still reach support | Prioritize fixes by volume, customer impact, and answer stability |
Self-service rate | Share or ratio of users who self-serve before contacting support | Use with a clear definition and consistent reporting window |
Content gap themes | Missing, weak, stale, or hard-to-find answers | Feed the content backlog with evidence rather than guesses |
Each metric has a weakness on its own.
Article views can reward confusing articles if users keep returning because the answer is unclear. Helpful ratings can be biased toward frustrated readers who bother to click a vote. Search volume can exaggerate broad terms that do not have one clean answer. Contact clicks may increase after you make support easier to find, even if the content is better.
That is normal. Knowledge base analytics works when you read metrics together.
For example, a billing article with high views, low helpful ratings, repeated searches for "invoice," and many contact clicks is probably not solving the job. The fix might be a stronger title, a clearer first paragraph, a separate invoice article, or a support form suggestion that points users to the exact answer before they submit.
A troubleshooting article with low views but high ticket volume for the same issue may have a findability problem. The content exists, but customers do not know what to search for, the title does not match their language, or the article is buried in the wrong category.
A product setup article with high helpful ratings and low ticket creation may be doing exactly what it should. That does not mean it needs constant editing. It means it should be protected during product changes because it is probably carrying real support load.
This is also where external analytics tools can help. Google Analytics events can measure user interactions such as page loads, link clicks, and other custom actions, which makes it possible to track contact clicks, support form starts, article exits, and other behavior around the help center. In support platforms, Zendesk describes a self-service score as total help center sessions divided by total users in tickets, which is useful as a simple ratio when the inputs are defined consistently.
Do not overstate precision. Self-service rate, self-service score, and ticket deflection are directional metrics unless you have strong identity matching between help center sessions and support tickets. Use them to spot movement, compare issue areas, and decide where to investigate next.
How to read search and content signals
Search is one of the strongest customer self-service analytics sources because it captures intent in the customer's own words.
A search query tells you what someone believed the help center should understand. That makes it different from a page view. The customer is not passively landing on content. They are telling you what they need.
Start with four search patterns:
High-search terms: common topics customers expect to find.
Zero-result searches: queries that return no matching article or no useful result.
Low-click searches: result pages where customers see options but do not open them.
Search-to-contact paths: searches followed by a support click, form start, chat open, or ticket.
Zero-result searches deserve special attention, but this article should not turn into a zero-result search guide. The short version is this: failed searches usually mean the content is missing, the article exists under different wording, the search setup lacks synonyms, or the customer is asking for something outside the current support scope. Helpview's detailed guide to zero-result searches goes deeper on clustering, interpreting, and fixing those queries.
Content gaps are the broader category. A gap can be a missing article, an incomplete explanation, an outdated step, a weak title, a hidden article, or a support answer that only exists in agent replies. In the analytics framework, content gaps are not guesses. They are patterns supported by searches, tickets, feedback, and contact behavior. Helpview's guide to finding content gaps in your help center covers that audit process in detail.
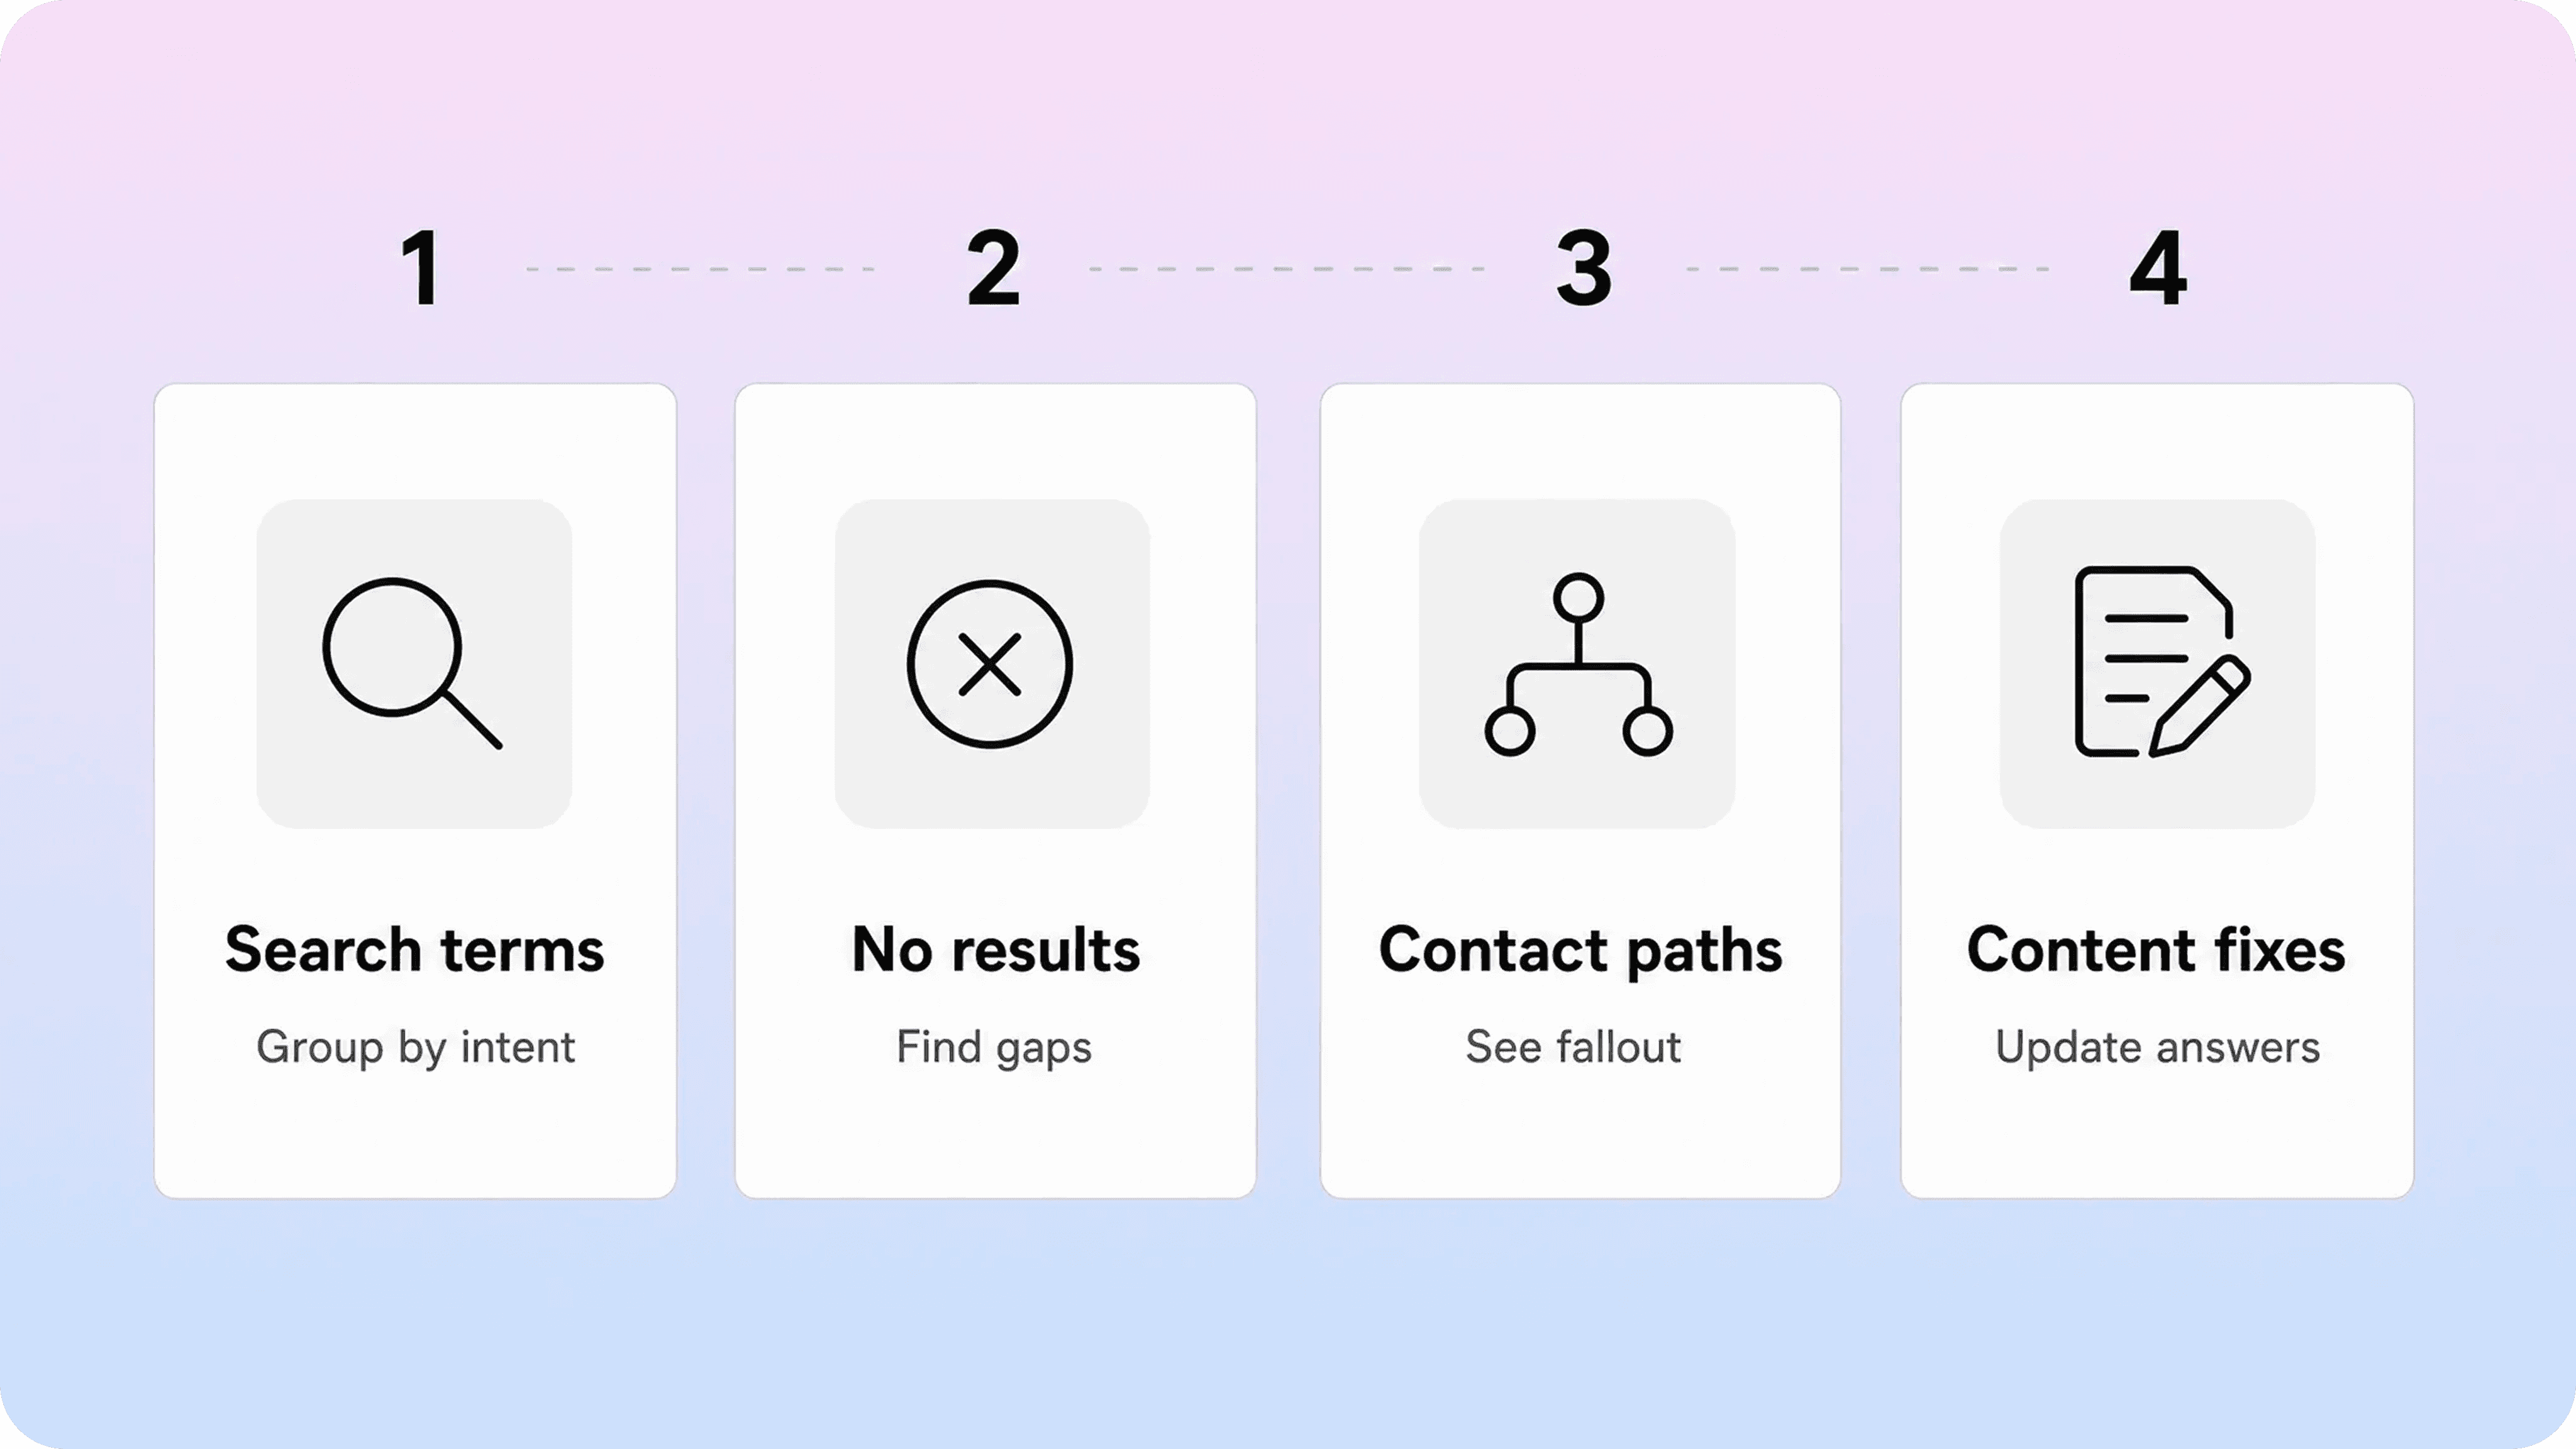
For the analytics pillar, keep the search review simple:
Export or review the last 30 to 90 days of search terms.
Group similar terms by customer intent.
Mark whether a relevant article exists.
Check whether the title and first paragraph match customer wording.
Compare each cluster with support tickets and contact form submissions.
Choose the smallest fix that would help the next customer.
That last step matters. Not every search problem needs a new article.
If customers search "invoice" but your article is called "billing documents," rename the page or add invoice wording near the top. If customers search "add user" but your product says "invite member," add synonyms and adjust the title. If customers search for a recurring error that has no public explanation, create a focused troubleshooting article. If customers search for a feature you do not offer, improve the empty state or route them clearly instead of publishing irrelevant content.
Search-to-contact behavior is especially useful because it shows where self-service fails after effort. A customer who searches, clicks an article, searches again, and then opens support is giving you a stronger signal than a customer who simply lands on a page and leaves.
When you see that pattern, ask:
Did the first result match the query?
Did the article answer the question near the top?
Was the answer too broad for the user's situation?
Did the article explain prerequisites, plan limits, roles, or edge cases?
Did the page offer the right next step before the user contacted support?
Microsoft's Dynamics 365 documentation describes knowledge analytics around article insights and search term insights, which is a useful way to think about the split. Article analytics show what content is being used. Search analytics show what customers are trying to find. The best decisions usually come from comparing both.
How to connect analytics to contact requests
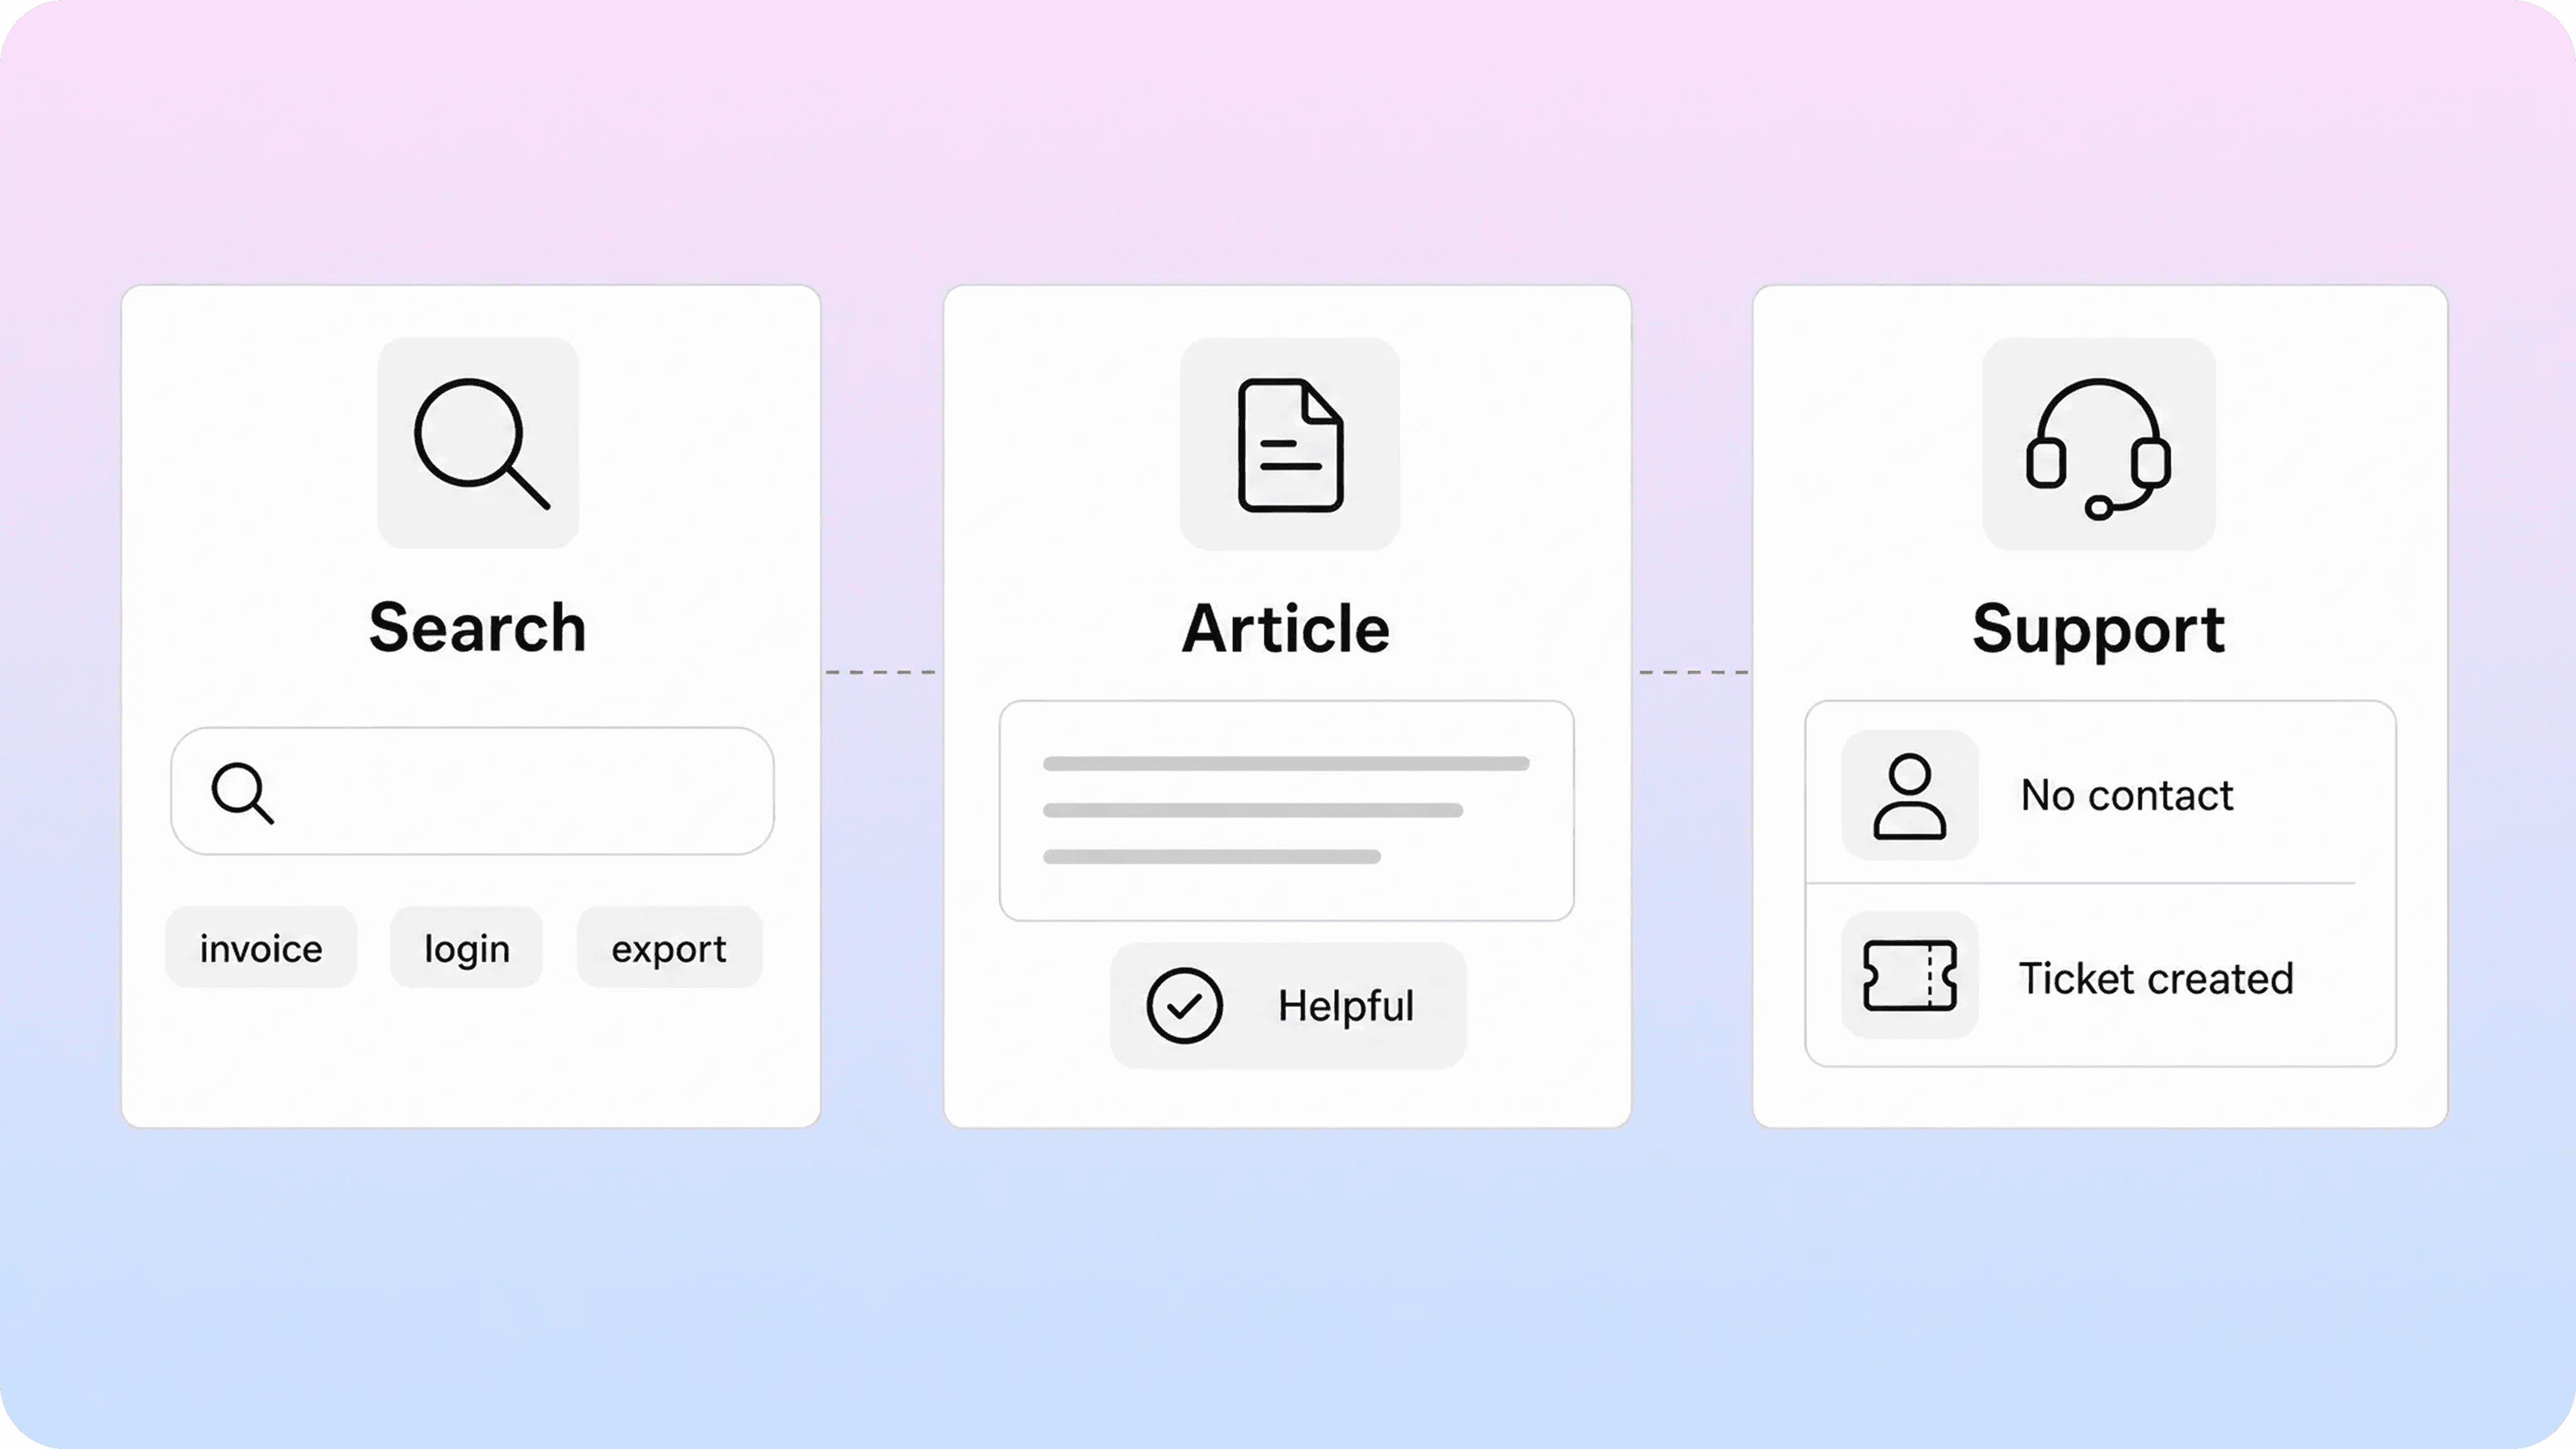
The hardest part of knowledge base analytics is measuring what did not happen.
If a customer reads an article and never contacts support, did the article solve the issue? Maybe. They may also have given up, solved the problem another way, or planned to contact support later. If tickets drop after an article update, did the article cause it? Maybe. The product may have changed, volume may have shifted, or support demand may have moved into chat.
That uncertainty is why ticket deflection should be handled carefully.
Ticket deflection is usually used to describe support requests that did not reach the team because self-service resolved the issue first. It is valuable, but it is often hard to prove at the individual customer level. A cleaner approach is to define a few practical signals and watch them consistently.
Useful outcome metrics include:
help center sessions compared with ticket submitters
article views followed by no contact within the same session
searches followed by no contact
searches followed by contact
support form starts after article views
suggested article clicks inside a support form
repeated ticket themes before and after article improvements
ticket volume for specific issues after new or updated articles
The most useful version is issue-level measurement.
Instead of asking, "Did the knowledge base deflect tickets overall?" ask, "Did the new invoice article reduce invoice tickets?" That is easier to reason about because the content, search terms, and ticket category are connected.
For example:
Before the fix: users search "invoice," open a broad billing article, then contact support.
Content action: publish "Download an invoice" and add invoice wording to billing pages.
After the fix: invoice searches return the focused article, contact clicks after that search drop, and invoice tickets decrease.
That is a much stronger story than a general claim that the knowledge base improved.
If your help center includes a contact form, support widget, or in-app help flow, track the moments before contact. A useful event path might look like:
Search performed.
Search result clicked.
Article viewed.
Helpful or not helpful vote.
Contact support clicked.
Support form submitted.
You do not need perfect attribution to learn from this. Even a basic report that shows top articles before contact can reveal weak pages, confusing categories, or missing next steps. A support form that suggests articles before submission can also show which answers prevent form completion and which ones fail to help.
This connects naturally to support operations. Helpview's article on support ticket categories can help teams group incoming requests so documentation fixes are tied to cleaner ticket themes. Helpview's guide on turning support questions into documentation is useful when repeated ticket patterns need to become actual articles.
Be careful with one common mistake: do not optimize only for fewer contact requests.
Some customers should contact support. Account security, billing disputes, legal questions, sensitive data, and edge cases may need a human. The goal of knowledge base analytics is not to hide support. It is to make sure customers who can self-serve get a clear answer, and customers who need help reach support with better context.
That is why contact quality matters too. If a user reads an article and then submits a ticket with the right category, account details, screenshots, or error code, the article may still have helped. It did not deflect the ticket, but it reduced friction and improved resolution speed.
A simple analytics review cadence
Knowledge base performance metrics become useful when someone reviews them on a repeatable rhythm.
A small team does not need a complex dashboard. It needs a habit. Once a month is enough for many teams. High-volume support teams may review search and contact data weekly, especially after product releases, pricing changes, migrations, or onboarding updates.
Use a simple monthly review:
Review top articles. Check the 10 most viewed articles for freshness, clarity, and repeated support themes.
Review search terms. Group the top searches, zero-result searches, and low-click searches by intent.
Review contact paths. Look at searches and article views that happened before contact clicks or ticket submissions.
Review article feedback. Read negative ratings and comments alongside ticket themes before making changes.
Choose five fixes. Pick the smallest set of updates likely to reduce repeat confusion.
Measure again. Compare the same issue-level signals after the update.
The output should be a short content backlog, not a giant analytics report.
Good backlog items are specific:
Rename "billing documents" to "Download invoices and receipts."
Add a troubleshooting section for the 403 login error.
Create a focused article for inviting teammates.
Add "cancel plan" wording to the subscription article.
Move the refund policy into the billing category.
Add a suggested article to the support form for password reset issues.
Weak backlog items are vague:
Improve analytics.
Make search better.
Add more docs.
Reduce tickets.
Update help center.
The difference is actionability. A good analytics review should tell the team what to change next.
This is also where ownership matters. Every important article should have an owner, a last-reviewed date, and a reason to update. If an article is tied to a high-volume ticket category, it should be reviewed more often than a low-risk evergreen explanation.
For help centers that support a changing product, analytics should also be part of the release workflow. Before a launch, identify which articles need updates. After the launch, watch searches, zero-result queries, article feedback, and tickets for new confusion. The first week after a product change often reveals wording gaps that were impossible to predict in planning.
Over time, the best knowledge base analytics system becomes a loop:
Customers search, read, vote, and contact support.
The team reviews the patterns.
The team updates titles, articles, categories, suggestions, and contact flows.
The team checks whether the same issue becomes easier to solve.
That loop is more important than any single metric. It keeps the knowledge base close to real customer language and real support demand.
Conclusion
Knowledge base analytics should help your team understand whether self-service is working in practice, not just whether articles are getting traffic. Track views, searches, zero-result searches, helpful ratings, contact requests, tickets after self-service, and issue-level deflection together. Then use those signals to make focused improvements: clearer titles, better search matches, stronger articles, smarter support-form suggestions, and a review cadence that keeps the help center aligned with what customers actually need.
Frequently asked questions
What is knowledge base analytics?
Knowledge base analytics is the measurement of how customers use help content and whether that content helps them solve problems. It usually includes article views, search queries, zero-result searches, helpful ratings, contact behavior, ticket patterns, and content gap analysis.
What are the most important knowledge base metrics?
How do you measure self-service rate?
What is the difference between knowledge base analytics and help center analytics?
Knowledge base analytics usually focuses on article and content performance, while help center analytics often includes the wider support experience: search, categories, feedback, contact forms, widgets, suggested articles, and tickets. In practice, the two overlap because a customer-facing knowledge base works only when the full help center journey helps people find answers.
Share article:

2 free months of Pro
Turn Notion pages into help center answers.
Keep writing in Notion and publish a real, searchable Notion help center.

Articles
Keep reading