Tips
Customer service metrics: what support teams should actually track

9 Min Read
Customer service metrics help support teams see where customers wait, where issues get stuck, how much effort support creates, and which improvements actually make the experience better.
Share article:


Start with the job your metrics need to do
Customer service metrics are only useful when they help the team make better decisions. A dashboard with twenty numbers may look mature, but it often hides the real question: what should the support team change this week?
Start with the operating job behind the metric. Some metrics tell you whether customers are waiting too long. Some tell you whether answers are actually solving the problem. Some show where customers are working too hard. Others reveal whether the team is handling volume in a sustainable way.
That distinction matters because customer service KPIs can pull against each other. A team can reduce first response time by sending quick shallow replies. It can lower average handle time by pushing complex issues away too early. It can improve ticket deflection while accidentally making the help center harder to trust. Zendesk makes a similar point in its guide to customer support metrics: individual metrics tell partial stories, so support leaders need to read them together.
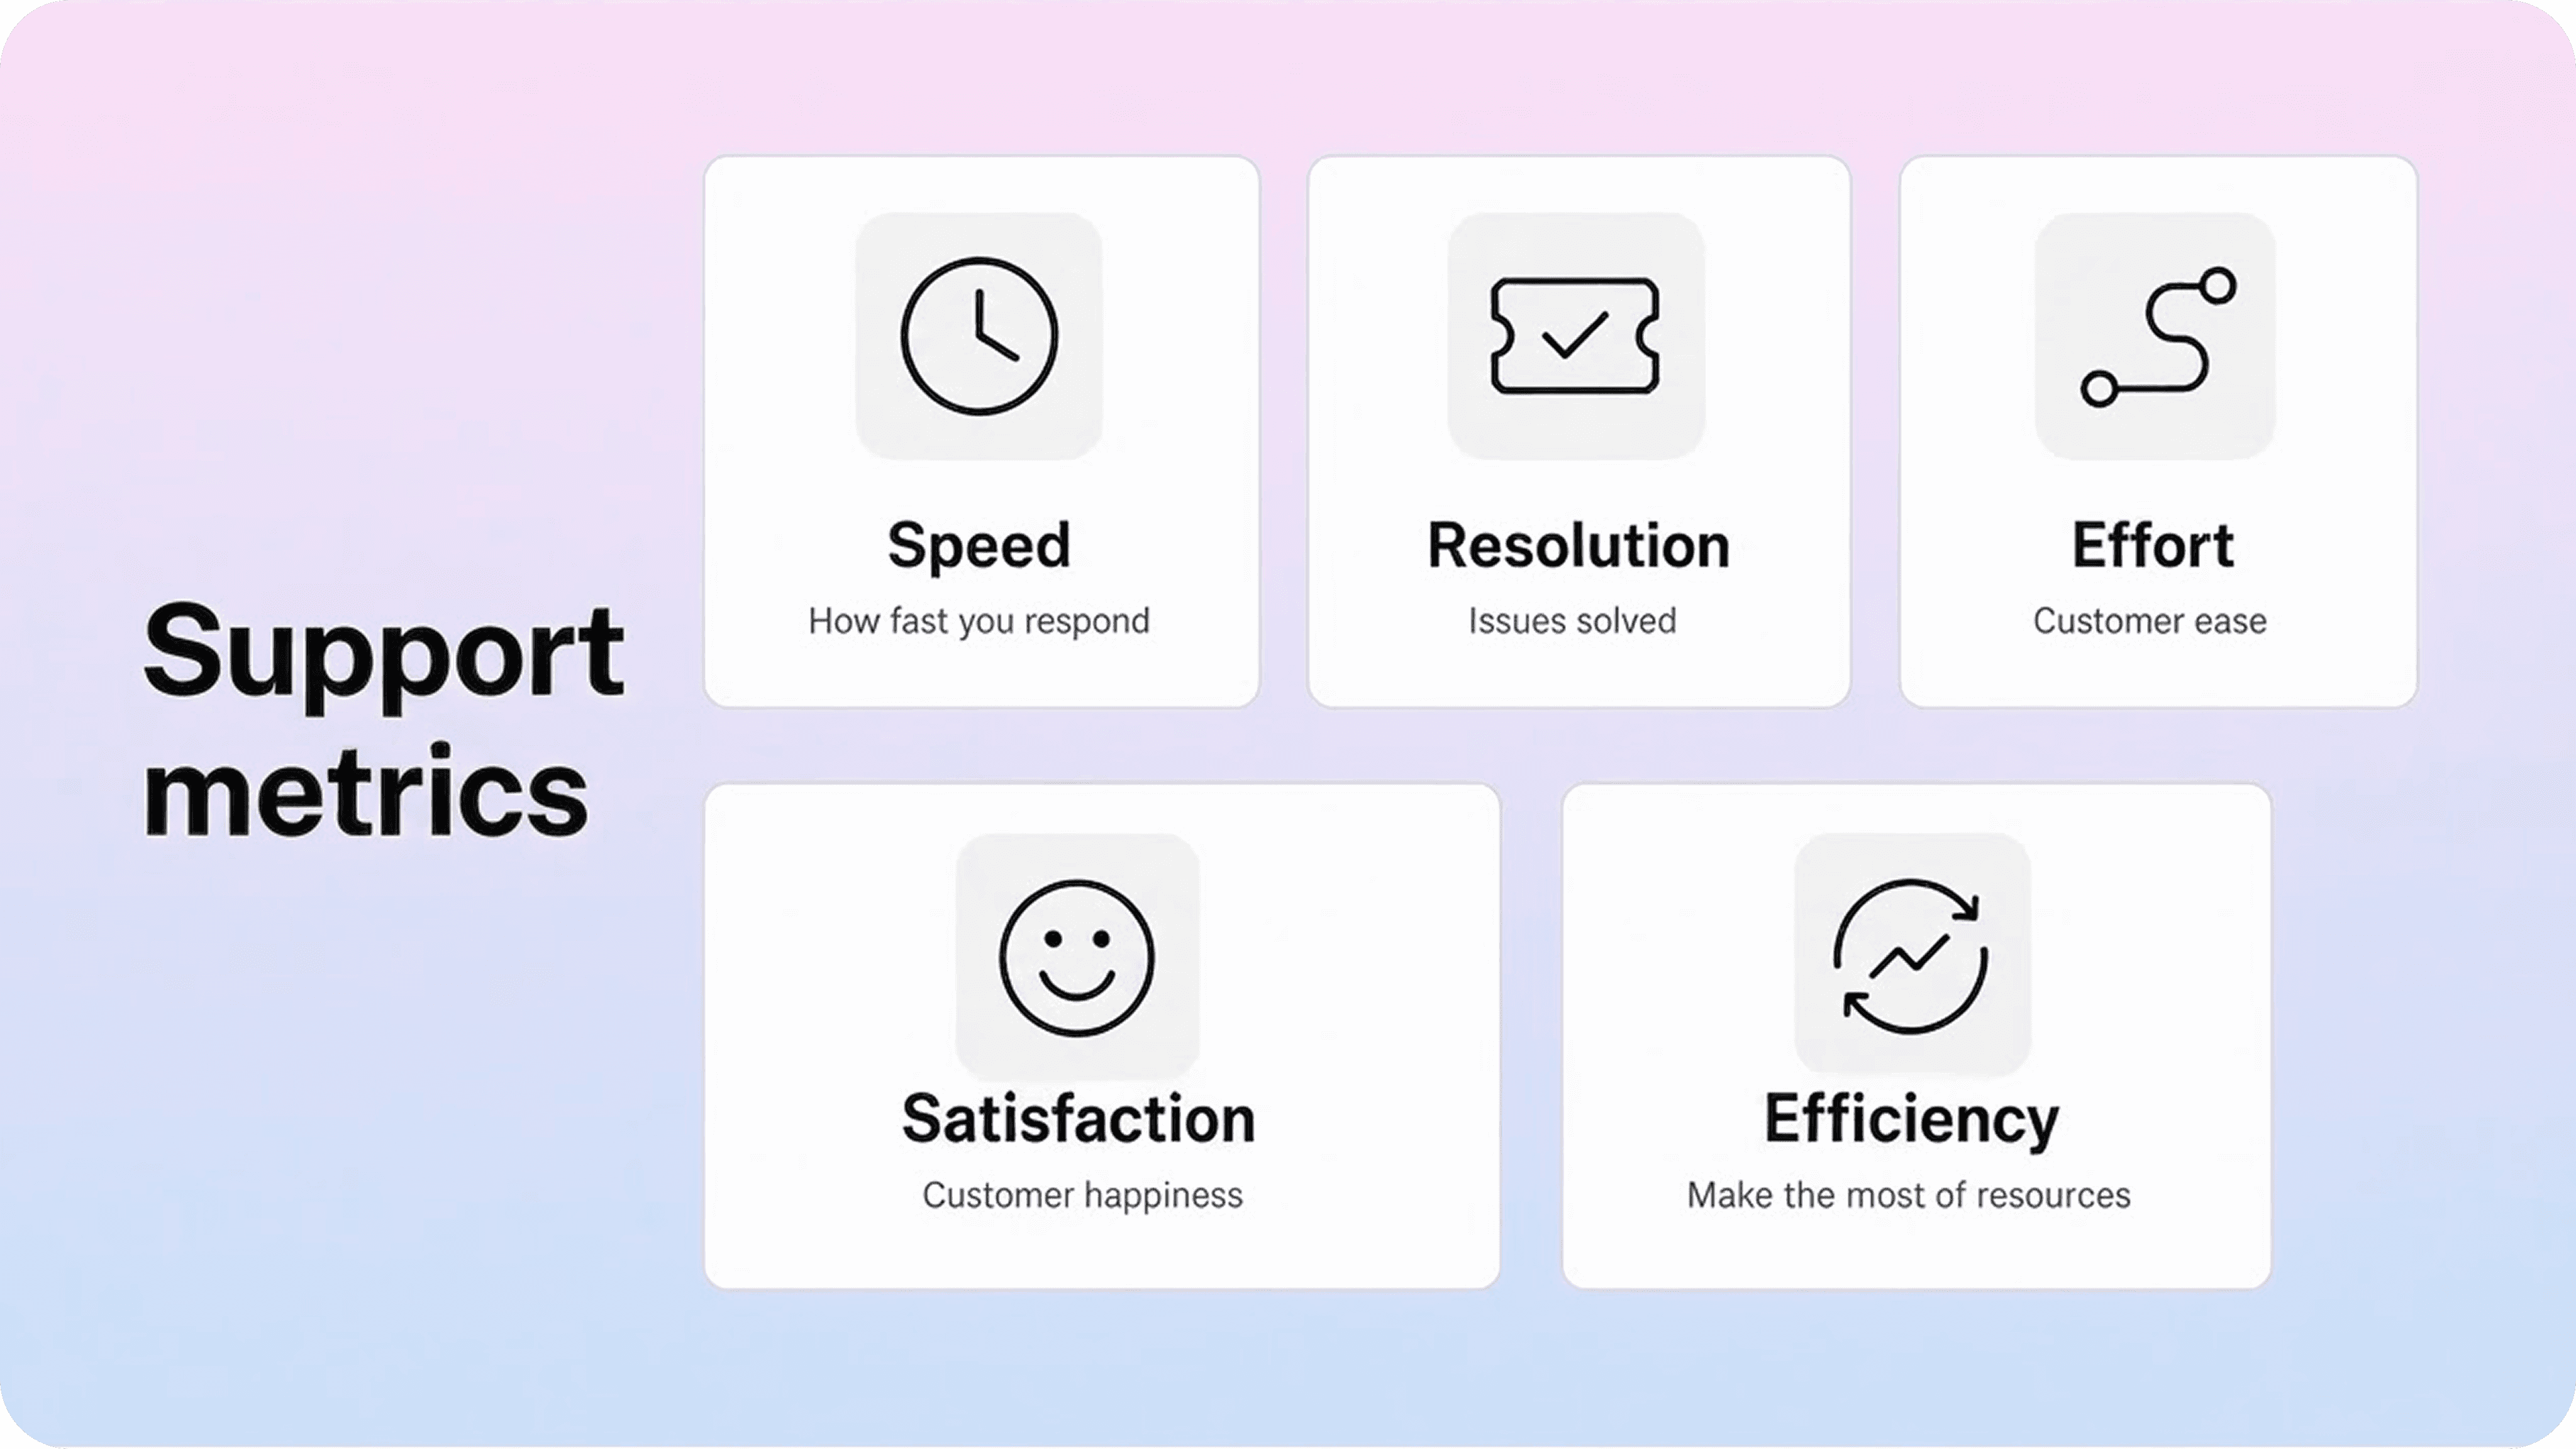
A practical customer service metrics set should answer five questions:
Are customers getting a first human or useful automated response quickly?
Are issues being resolved without unnecessary delay?
Are customers working too hard to get help?
Are customers satisfied with the support experience?
Is the team using its time on the right work?
Those five questions create a better dashboard than a random list of customer support KPIs. They also make it easier to explain performance to founders, product teams, success teams, and finance without reducing support to speed alone.
Track response speed without rewarding shallow replies
Response speed is usually the first metric support leaders look at because customers feel waiting immediately. If a customer asks for help and hears nothing, the experience starts to deteriorate before anyone reads the ticket.
The core speed metrics are:
First response time: how long it takes to send the first meaningful reply.
Average response time: how long customers wait between replies across the full conversation.
SLA achievement: the percentage of conversations answered or resolved within the promised target.
Time to assignment: how long it takes a ticket to reach the right person or queue.
First response time is the most visible speed metric, but it needs a careful definition. A meaningful first response should move the issue forward. An auto-reply that says “we received your message” may be useful for acknowledgement, but it should not be counted the same way as an answer from a support agent.
Segment speed by channel. Live chat, email, in-app support, and social support create different expectations. A single blended first response time can hide the fact that chat is healthy while email is slipping, or that enterprise customers are getting fast help while free users wait too long.
Speed also needs quality checks. If first response time improves while reopen rate, customer effort, or CSAT gets worse, the team may be answering quickly without solving enough. That is why response metrics should sit beside resolution and satisfaction metrics, not above them.
Use speed metrics to improve systems, not just pressure people. Slow first response time may mean staffing coverage is wrong. It may mean routing rules are too broad. It may mean agents spend too much time rewriting the same replies. It may also mean the help center is not answering obvious questions before they become tickets.
Measure resolution, not just activity
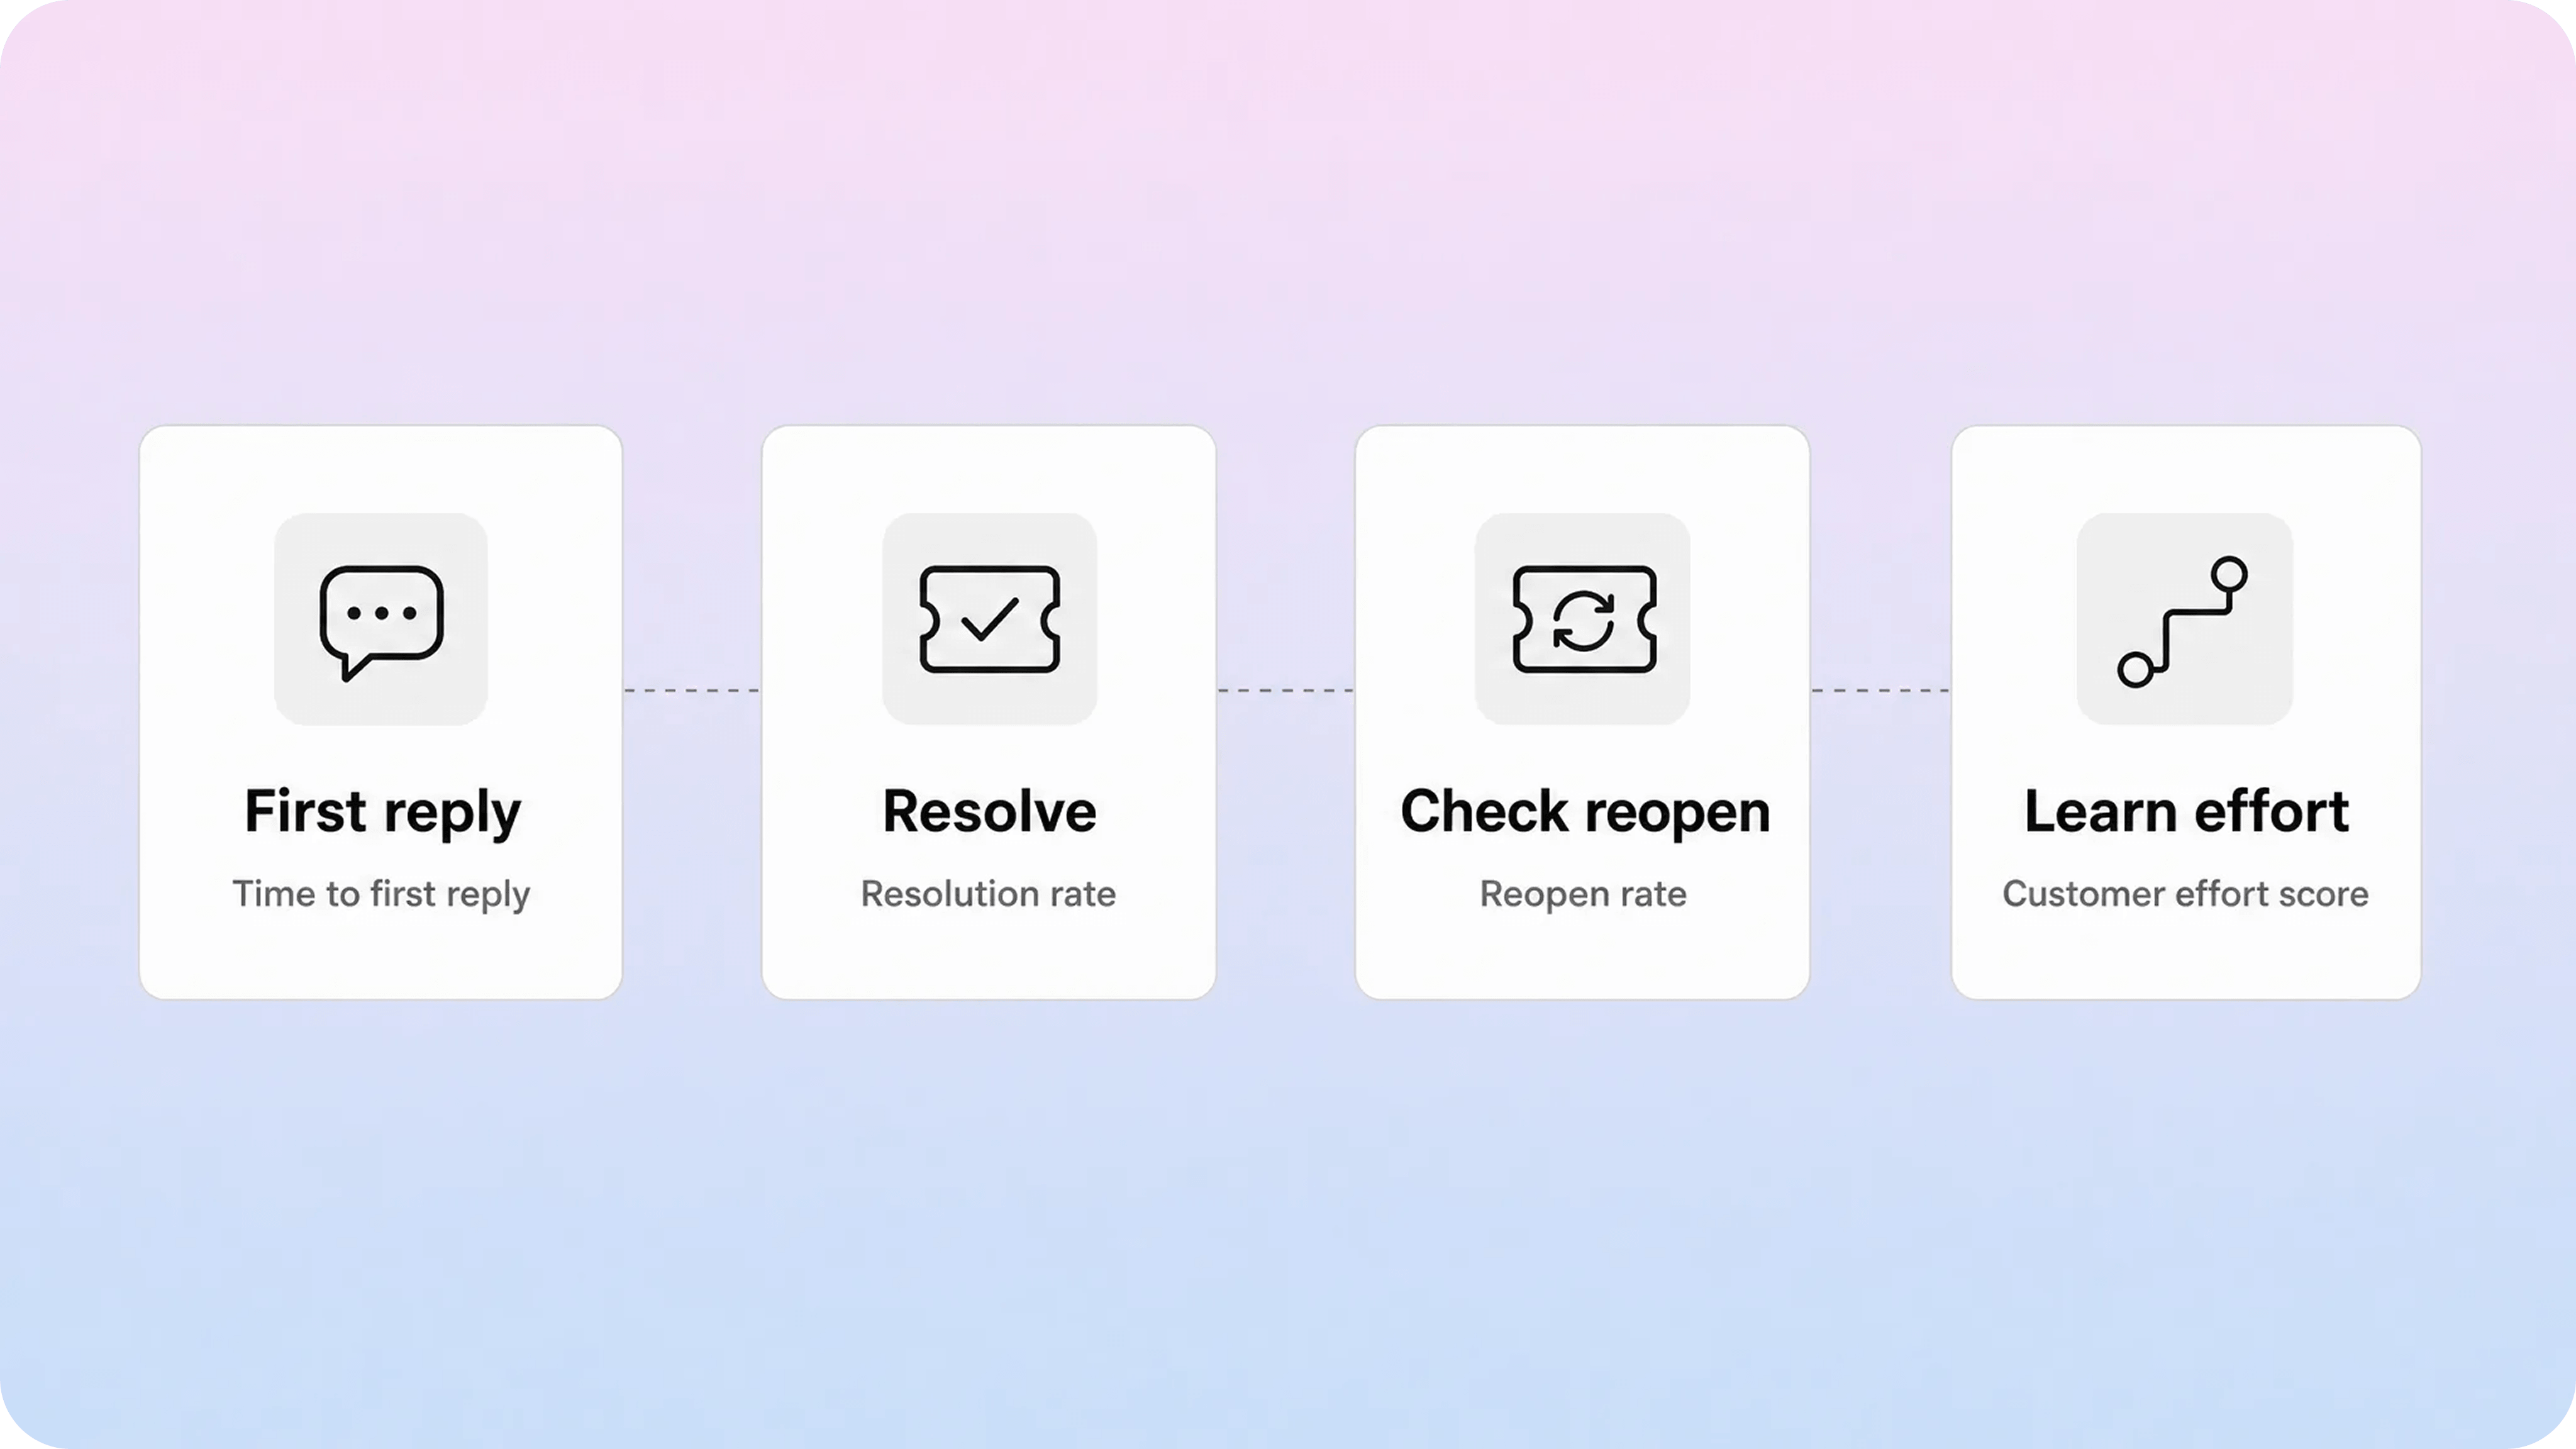
Resolution metrics show whether support is actually solving customer problems. This is where many support dashboards become more useful because they move beyond “how busy are we?” and toward “did the customer get unstuck?”
The most useful resolution metrics are:
Average resolution time: how long it takes to close an issue.
First contact resolution: the percentage of issues solved in the first meaningful interaction.
Reopen rate: the percentage of closed tickets that come back because the answer did not hold.
Escalation rate: the percentage of issues that need another team or senior agent.
Backlog age: how long unresolved tickets have been waiting.
First contact resolution is especially useful, but it can be misleading if the definition is too loose. Closing a ticket after one reply does not always mean the issue was resolved. The customer may have given up, solved it alone, or opened a new ticket later. Pair FCR with reopen rate, customer satisfaction, and follow-up volume so the number reflects the customer’s reality.
Average resolution time also needs segmentation. Billing questions, account access issues, product bugs, feature requests, and technical troubleshooting should not all be measured against the same expectation. Some issues should resolve quickly. Others need investigation, product input, or engineering work.
This is where support and product should share responsibility. If the same setup question creates hundreds of tickets, the solution may be better documentation or onboarding. If the same bug creates long resolution times, the support team can explain the pattern, but product and engineering need to fix the cause.
Resolution metrics should lead to practical workflow questions:
Which issue types take longest to resolve?
Which tickets reopen most often?
Which escalations could be prevented with clearer internal notes?
Which replies need better macros or approved answer snippets?
Which help articles are missing, unclear, or hard to find?
Kayako’s customer support metrics guide separates support interaction metrics from broader customer success outcomes such as retention or expansion. That distinction is useful: support should influence customer health, but the team needs metrics it can actually act on day to day.
Watch customer effort and satisfaction together
Customer satisfaction is important, but it does not tell the whole story. A customer may rate an agent highly because the agent was kind and helpful, even though the process was painful. Another customer may get a technically correct answer and still leave frustrated because it took too many steps.
Track satisfaction and effort together:
Metric | What it tells you | Best use |
|---|---|---|
CSAT | Whether the customer was satisfied after an interaction | Spot team, queue, article, or issue-type experience problems |
CES | How hard it felt to get the issue resolved | Find friction in support flows, docs, routing, and product UX |
Sentiment or feedback themes | What customers say in their own words | Understand why a score changed |
Complaint trends | Which issues create repeated frustration | Prioritize fixes across support, docs, and product |
CSAT is one of the most common customer service KPIs because it is easy to ask after a support interaction. IBM’s guide to customer service metrics describes CSAT, CES, NPS, response time, resolution time, ticket volume, backlog, and retention-related measures as part of a wider service measurement set.
For support operations, CSAT works best when it is tied to the specific interaction. Ask for feedback after the ticket closes, then review the score by channel, issue type, customer segment, and agent group. Do not overreact to one bad rating, but do read the comments. The comment often explains the real issue better than the score.
Customer effort score is just as useful for finding hidden friction. A low-effort experience usually means the customer found the right answer, contacted the right path, avoided repeated explanation, and did not have to chase status. A high-effort experience may point to missing documentation, confusing product settings, weak ticket routing, or too many handoffs.
NPS can be useful at the company level, but it is not always the best daily support metric. It reflects a broader relationship with the product, pricing, onboarding, reliability, and brand. Support should understand it, but day-to-day support improvements usually come faster from CSAT, CES, issue themes, and resolution metrics.
Use efficiency metrics to improve the system
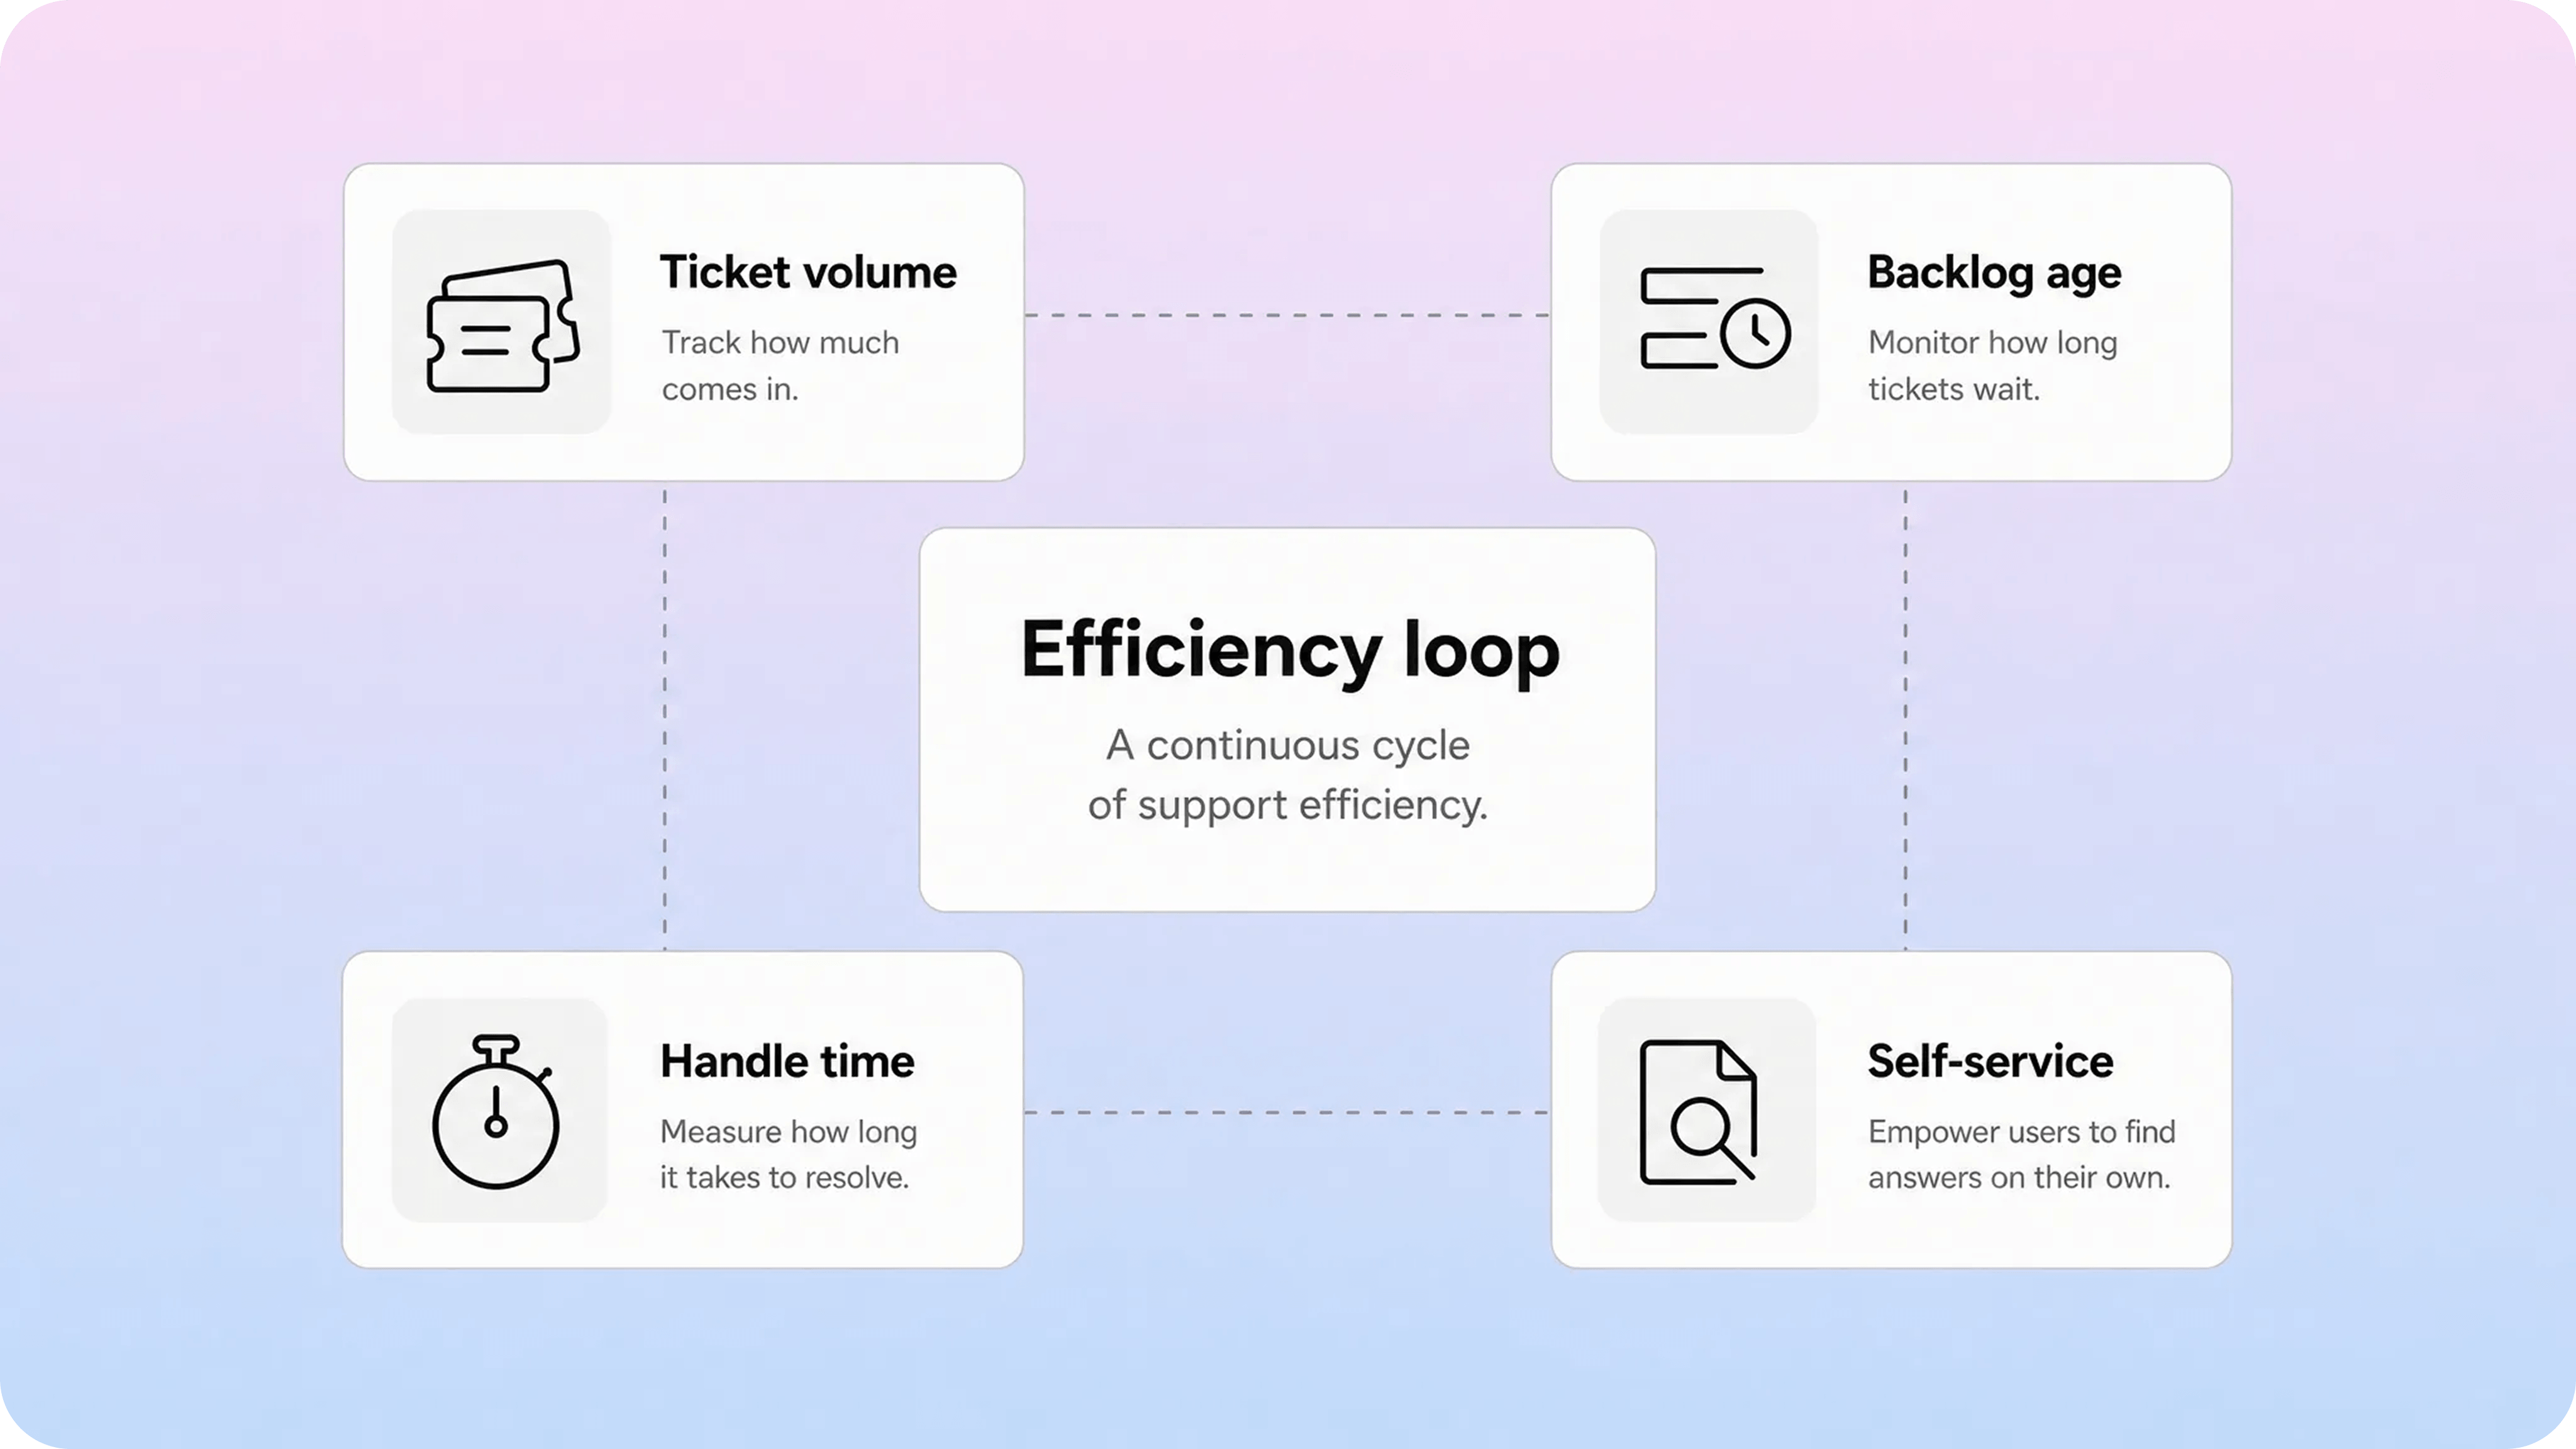
Support efficiency is not about making agents move faster at any cost. It is about helping the team spend less time on avoidable work and more time on issues that genuinely need human judgment.
Useful efficiency metrics include:
Ticket volume by topic.
Ticket volume per active customer.
Backlog size and backlog age.
Average handle time.
Agent utilization.
Cost per contact.
Deflection rate.
Self-service success.
Top searched terms and zero-result searches.
Ticket volume is the starting point. Track it by issue type, channel, plan, product area, and customer segment. Volume alone does not prove success or failure, but changes in volume often show where the product, documentation, onboarding, or billing experience has changed.
Average handle time should be used carefully. It can help with staffing and process planning, but it becomes harmful when agents feel rewarded for ending conversations quickly instead of resolving them well. AHT is more useful when paired with resolution quality, reopen rate, and CSAT.
Deflection and self-service metrics are especially relevant for teams with a help center. A good help center does not simply “reduce tickets.” It answers repeat questions before they become tickets, helps customers use the product confidently, and gives agents approved content to reuse when tickets do arrive.
For Helpview-style support teams, useful self-service signals include:
Which articles get the most views.
Which searches return no useful result.
Which articles receive poor feedback.
Which tickets could have been solved by an existing article.
Which macros or replies should become new help center content.
Which articles need clearer titles, screenshots, or next steps.
Helpview’s guide to zero-result searches is a good companion metric here because it turns search failures into content work. If many customers search for a topic and find nothing, the support team has a measurable content gap, not just a vague feeling that docs need improvement.
Build a dashboard support teams can actually use
The best customer service metrics dashboard is smaller than most teams expect. It should show enough to guide decisions without becoming a reporting chore.
For a practical starting set, track:
First response time.
Average resolution time.
First contact resolution.
Reopen rate.
CSAT.
Customer effort score.
Ticket volume by topic.
Backlog age.
Escalation rate.
Self-service performance.
That set covers speed, resolution, satisfaction, effort, workload, and support efficiency. It also avoids the common mistake of measuring only agent activity while ignoring customer friction.
Set targets only after you segment the data. A target for live chat should not be copied to email. A target for billing questions should not be copied to complex technical investigations. A target for a small early-stage team should not be copied from an enterprise benchmark without context.
Shopify’s guide to customer service metrics lists first response time, average resolution time, first contact resolution, CSAT, CES, average handle time, agent utilization, and NPS as common metrics. That list is a useful starting point, but the operating value comes from deciding which ones matter for your team’s support model.
Review metrics weekly for operations and monthly for trends. Weekly reviews should ask what changed, where the queue is stuck, and what needs immediate adjustment. Monthly reviews should ask which issues are recurring, which docs need improvement, which product areas create the most effort, and whether staffing matches demand.
Keep the dashboard close to the work. If metrics live only in a leadership slide, agents will not trust them. Share the patterns, ask for context, and turn the numbers into better routing, clearer docs, stronger internal notes, and more useful customer-facing answers.
Turn metrics into better support content
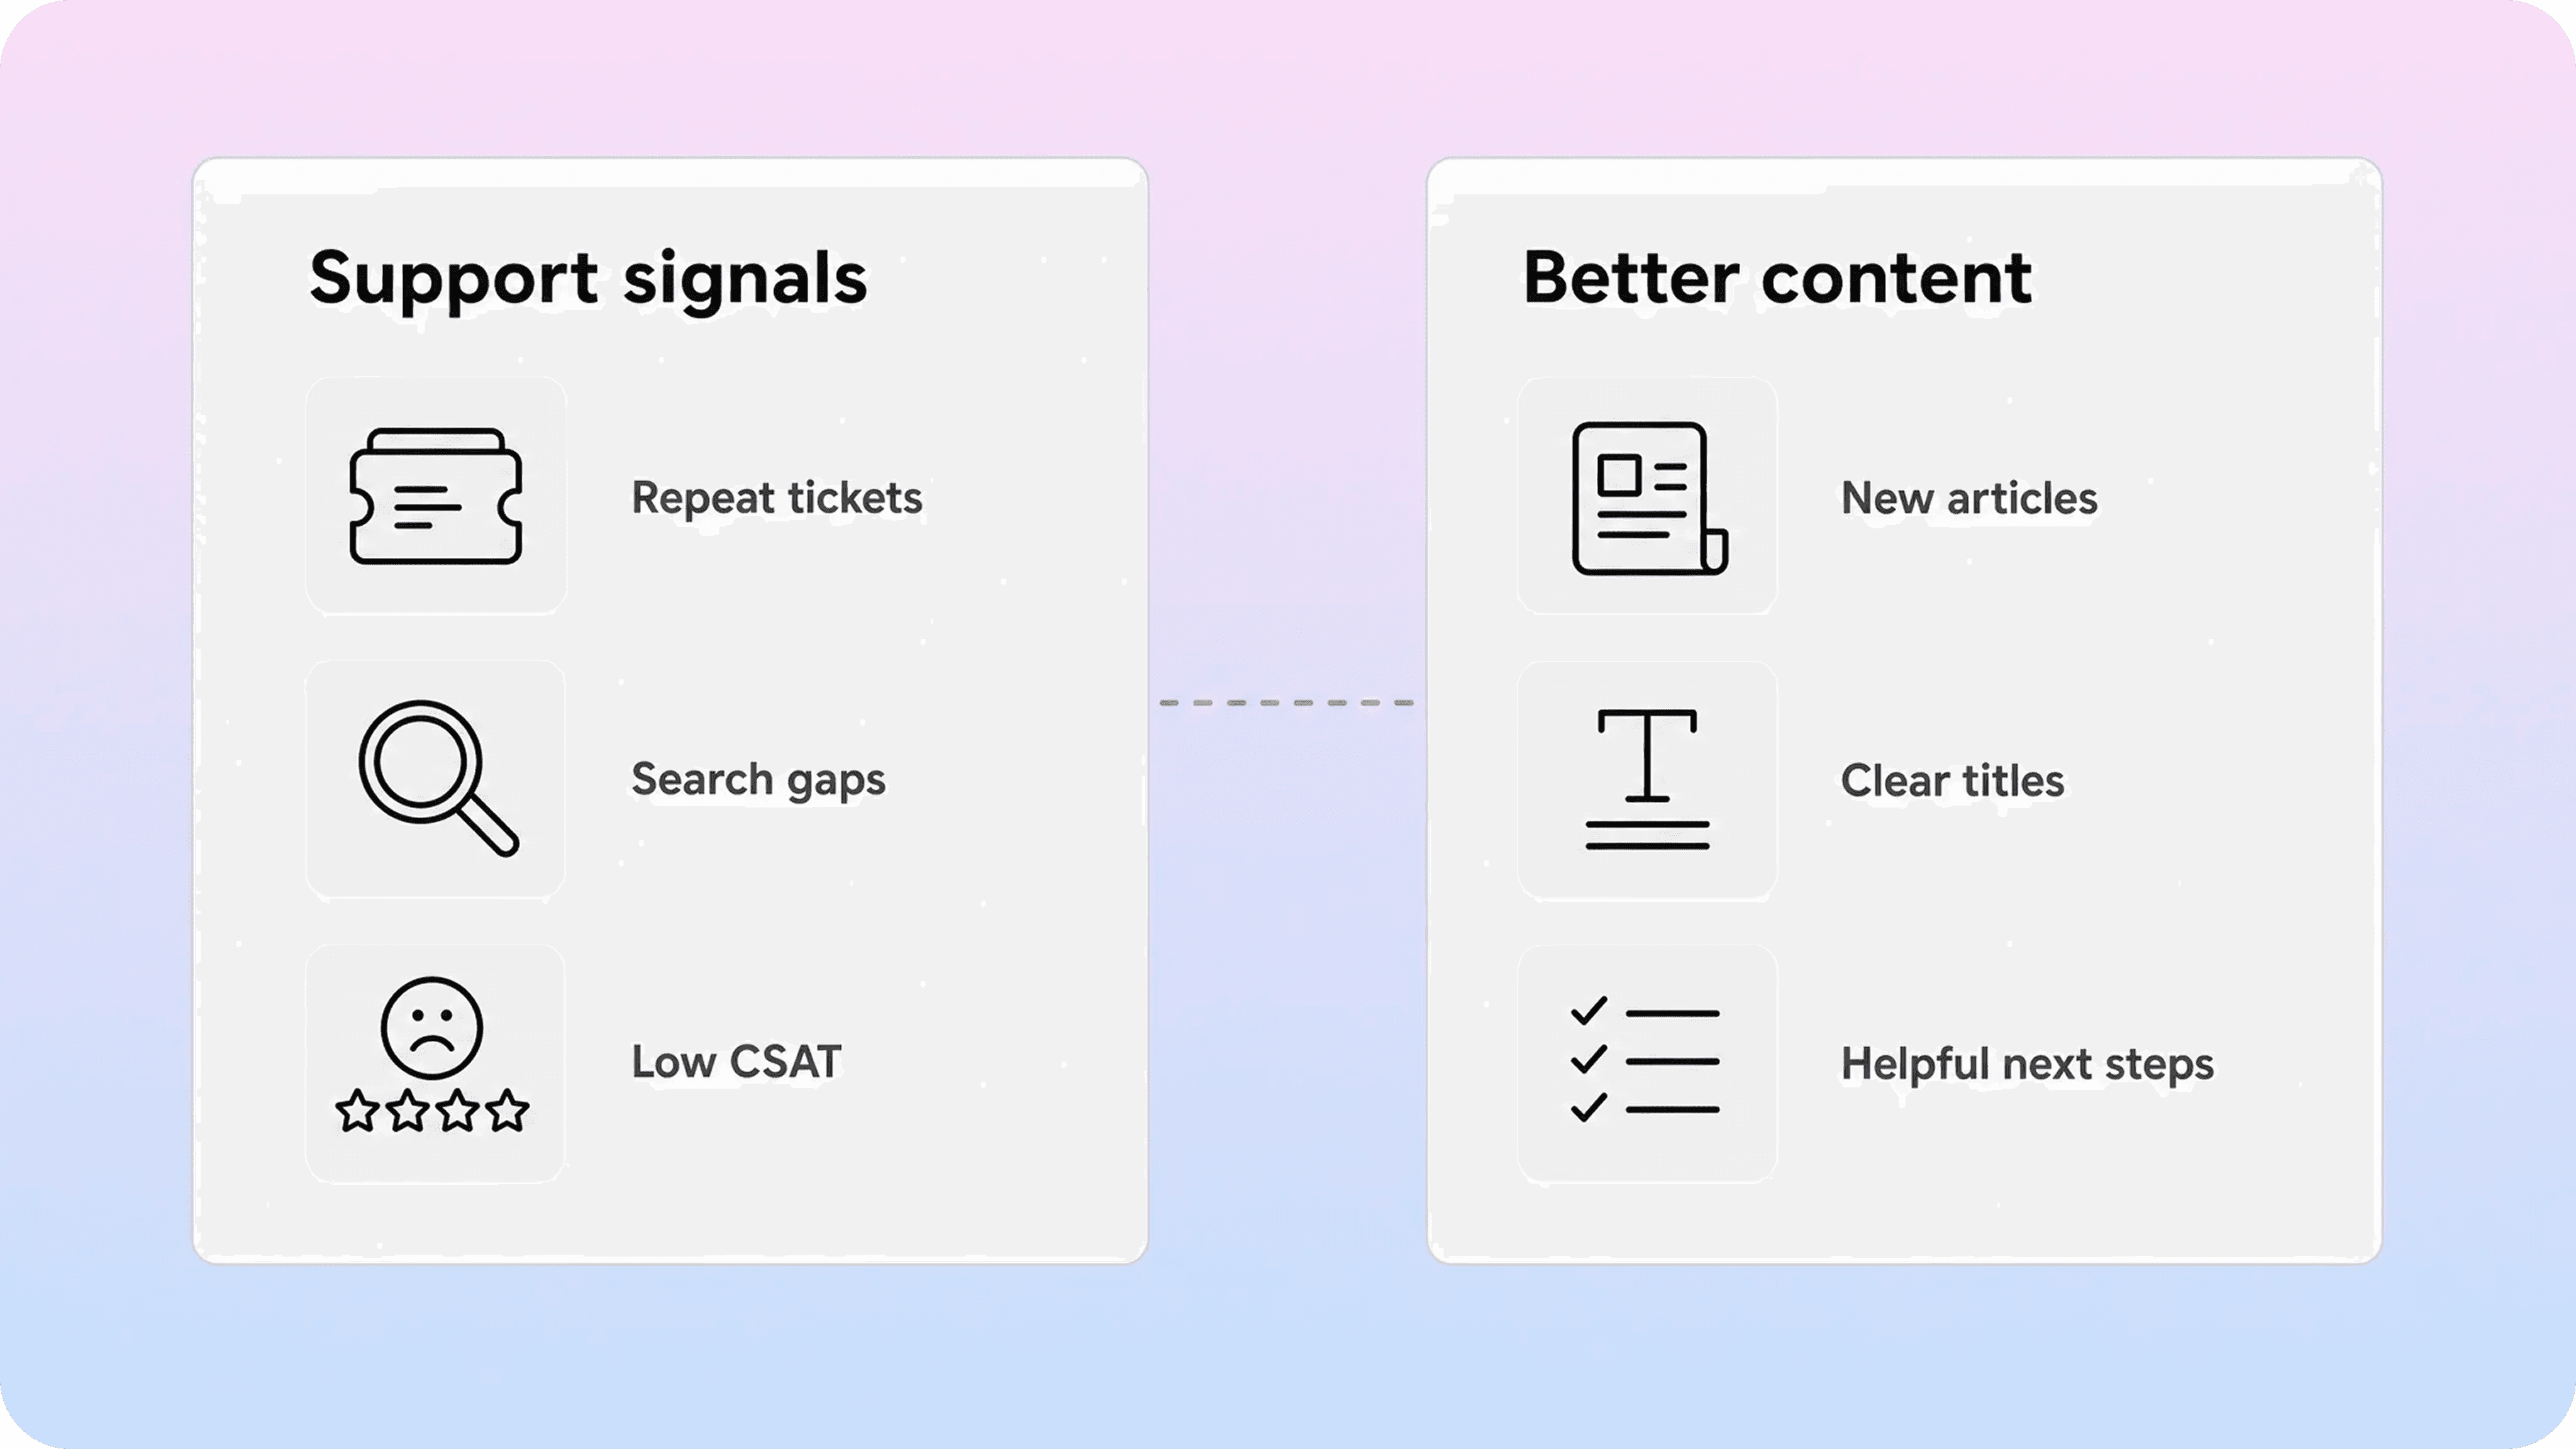
Customer service metrics become much more valuable when they feed documentation. The support team sees what customers ask, where they get confused, which replies work, and which problems return. That is exactly the raw material a help center needs.
Use metrics to improve support content in four ways.
First, turn repeated tickets into articles. If agents answer the same question every week, the answer should probably exist in the help center. Keep the article specific: what the customer is trying to do, what steps to follow, what to expect, and where to go next.
Second, use search data to improve findability. If customers search for terms that do not match article titles, add clearer wording. If searches return no results, create missing articles or rename existing ones. If customers open an article but still contact support, the article may need a better answer, better screenshots, or a clearer next step.
Third, connect agent workflows to docs. Approved support replies, macros, troubleshooting notes, and escalation explanations can become public articles when they answer repeat customer questions. The reverse is also true: strong help articles make agent replies faster and more consistent.
Fourth, review content performance alongside ticket performance. A drop in tickets for a topic may mean the help center is working. A rise in tickets after a product release may mean release notes, onboarding docs, or in-app help did not explain the change clearly enough.
This is where a Notion-based workflow can help. Support teams often already draft answers, internal notes, and product explanations in Notion. Publishing that knowledge through a structured help center keeps the writing workflow familiar while making the public experience easier to search and navigate.
For more adjacent reading, Helpview’s guides to knowledge base software, in-app knowledge bases, and finding content gaps all support the same loop: measure what customers need, improve the content, and make answers easier to find before a ticket is created.
Conclusion
Customer service metrics should help support teams improve the customer experience, not just prove that agents are busy. Start with a focused set across speed, resolution, effort, satisfaction, and efficiency. Read the metrics together, segment them by channel and issue type, and use them to improve the systems around support: routing, staffing, macros, escalation paths, product feedback, and customer-facing documentation.
Frequently asked questions
What are customer service metrics?
Customer service metrics are measurements that show how well a support team handles customer requests. They can track speed, resolution quality, customer satisfaction, customer effort, workload, team efficiency, and self-service performance.
What customer service metrics should support teams track first?
What is the difference between customer service metrics and customer service KPIs?
Is first response time the most important support metric?
How often should support teams review customer service metrics?
Share article:

2 free months of Pro
Turn Notion pages into help center answers.
Keep writing in Notion and publish a real, searchable Notion help center.

Articles
Keep reading